

This is a lengthy post about Oklahoma’s public schools. I’ll explore the state’s low rankings and delve into its history of student testing and achievement, student poverty, and finally school spending and taxation. I expect this might be my final post on such matters given that I am now in the twilight of my career.
Bona fides
My retirement in June 2026 will come at the end of 38 years working in Oklahoma public schools. I spent a semester student teaching at Norman High School, then a semester substituting in various classes at the three high schools in the Putnam City district. I then moved from the state’s central metroplex to Green Country in the northeast to teach physics for 28 years at Bartlesville High School, and this is my ninth and final year as a district administrator in Bartlesville.
My familiarity with the state’s educational spending, policies, and reforms includes how early in my teaching career I participated in the school suspension of 1990 that helped push through House Bill 1017, a vital educational reform law. I was afforded a significant role in another school suspension in 2018 that again boosted educational funding. I also learned about school funding during my 22 years on the local teachers’ union contract bargaining team, including 16 as the chief negotiator, and my varied involvement in the planning, promotion, and implementation of 15 school bond issues. I gained experience with achievement assessments during my decades chairing our district’s science department.
I also grew up in Oklahoma’s public schools. Kindergarten was at Western Village Elementary in Oklahoma City, grades 1-6 at Putnam City Central in Bethany, and I attended Putnam City’s Mayfield Junior High and Putnam City West High School. So I have spent over a half-century attending or working in the state’s public schools.
Low rankings
It made the news when Oklahoma’s school systems were ranked 50th out of 51 in WalletHub’s 2025 analysis, which included the District of Columbia. Similarly, Oklahoma was ranked 49th out of 50 on Kids Count, 48th out of 50 by U.S. News and World Report, and 48th out of 51 by World Population Review.

The truth is not always simple

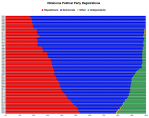
One political meme in circulation has laid the blame for the state’s low ranking on its recent Republican governors. The one shown has been circulating for some time, using old Quality Counts rankings from Education Week.
What that meme conveniently leaves out is how Oklahoma’s ranking in Quality Counts might have started at 19 when the Democrat Brad Henry took office, but it dipped as low as at least 28 during his term before rising to 17. While it did drop precipitously to 48th during Republican Mary Fallin’s eight years as governor, that drop took only four years and coincided precisely with the term of the controversial State Superintendent Janet Barresi. The meme also leaves out that the basis for the Quality Counts rankings changed over time, so comparing its overall ranking over the years is sometimes comparing apples to oranges, and Quality Counts was discontinued back in 2021.
Only three components of Quality Counts persisted from 2008 to 2021: achievement, finance, and “chance for success”, with the last one consisting of factors over which schools have no control such as family income, parent education, and parental employment.

Comparing the Quality Counts reports from year to year, the perilous drop from 17th overall in 2011 to 48th in 2015 was driven mostly by policy changes, with Oklahoma losing ground in a “teaching profession” component that was discontinued after 2014. We were docked for discontinuing teacher mentoring, teacher professional development, and teacher incentives under Supt. Barresi.
The state’s achievement rank also dropped in Quality Counts from 35th to 41st across those same years. However, it is interesting to note that most of the state’s scores in reading and math on the National Assessment of Educational Progress, which features prominently in most ranking systems, actually improved, sometimes markedly, during Supt. Barresi’s tenure.

The other thing of note in the NAEP scores is how Oklahoma’s 2022 and 2024 scores fell, along with the nation’s, due to the Covid-19 pandemic, often with a widening gap between the state and national averages.
Student achievement testing history
Let’s pull back and look at the national NAEP Long Term Trends scores, which are more statistically valid for long-term comparisons since their format is more stable, while the other NAEP assessments evolve over time to reflect current educational trends. Since they began for students of ages 9 and 13 in reading in 1971 and in math in 1973, the Long Term Trends assessments have only had one change in format and accommodations in 2004.

In 1983, the A Nation at Risk report focused attention on public school reforms. It pushed for increased rigor and standards, including requiring more high school courses in core subjects, increasing instructional time and teacher quality, and so forth. You can see how that correlated with a significant increase in age 9 math scores in the 1980s and age 13 math scores in the 1990s, but reading scores showed no improvement.
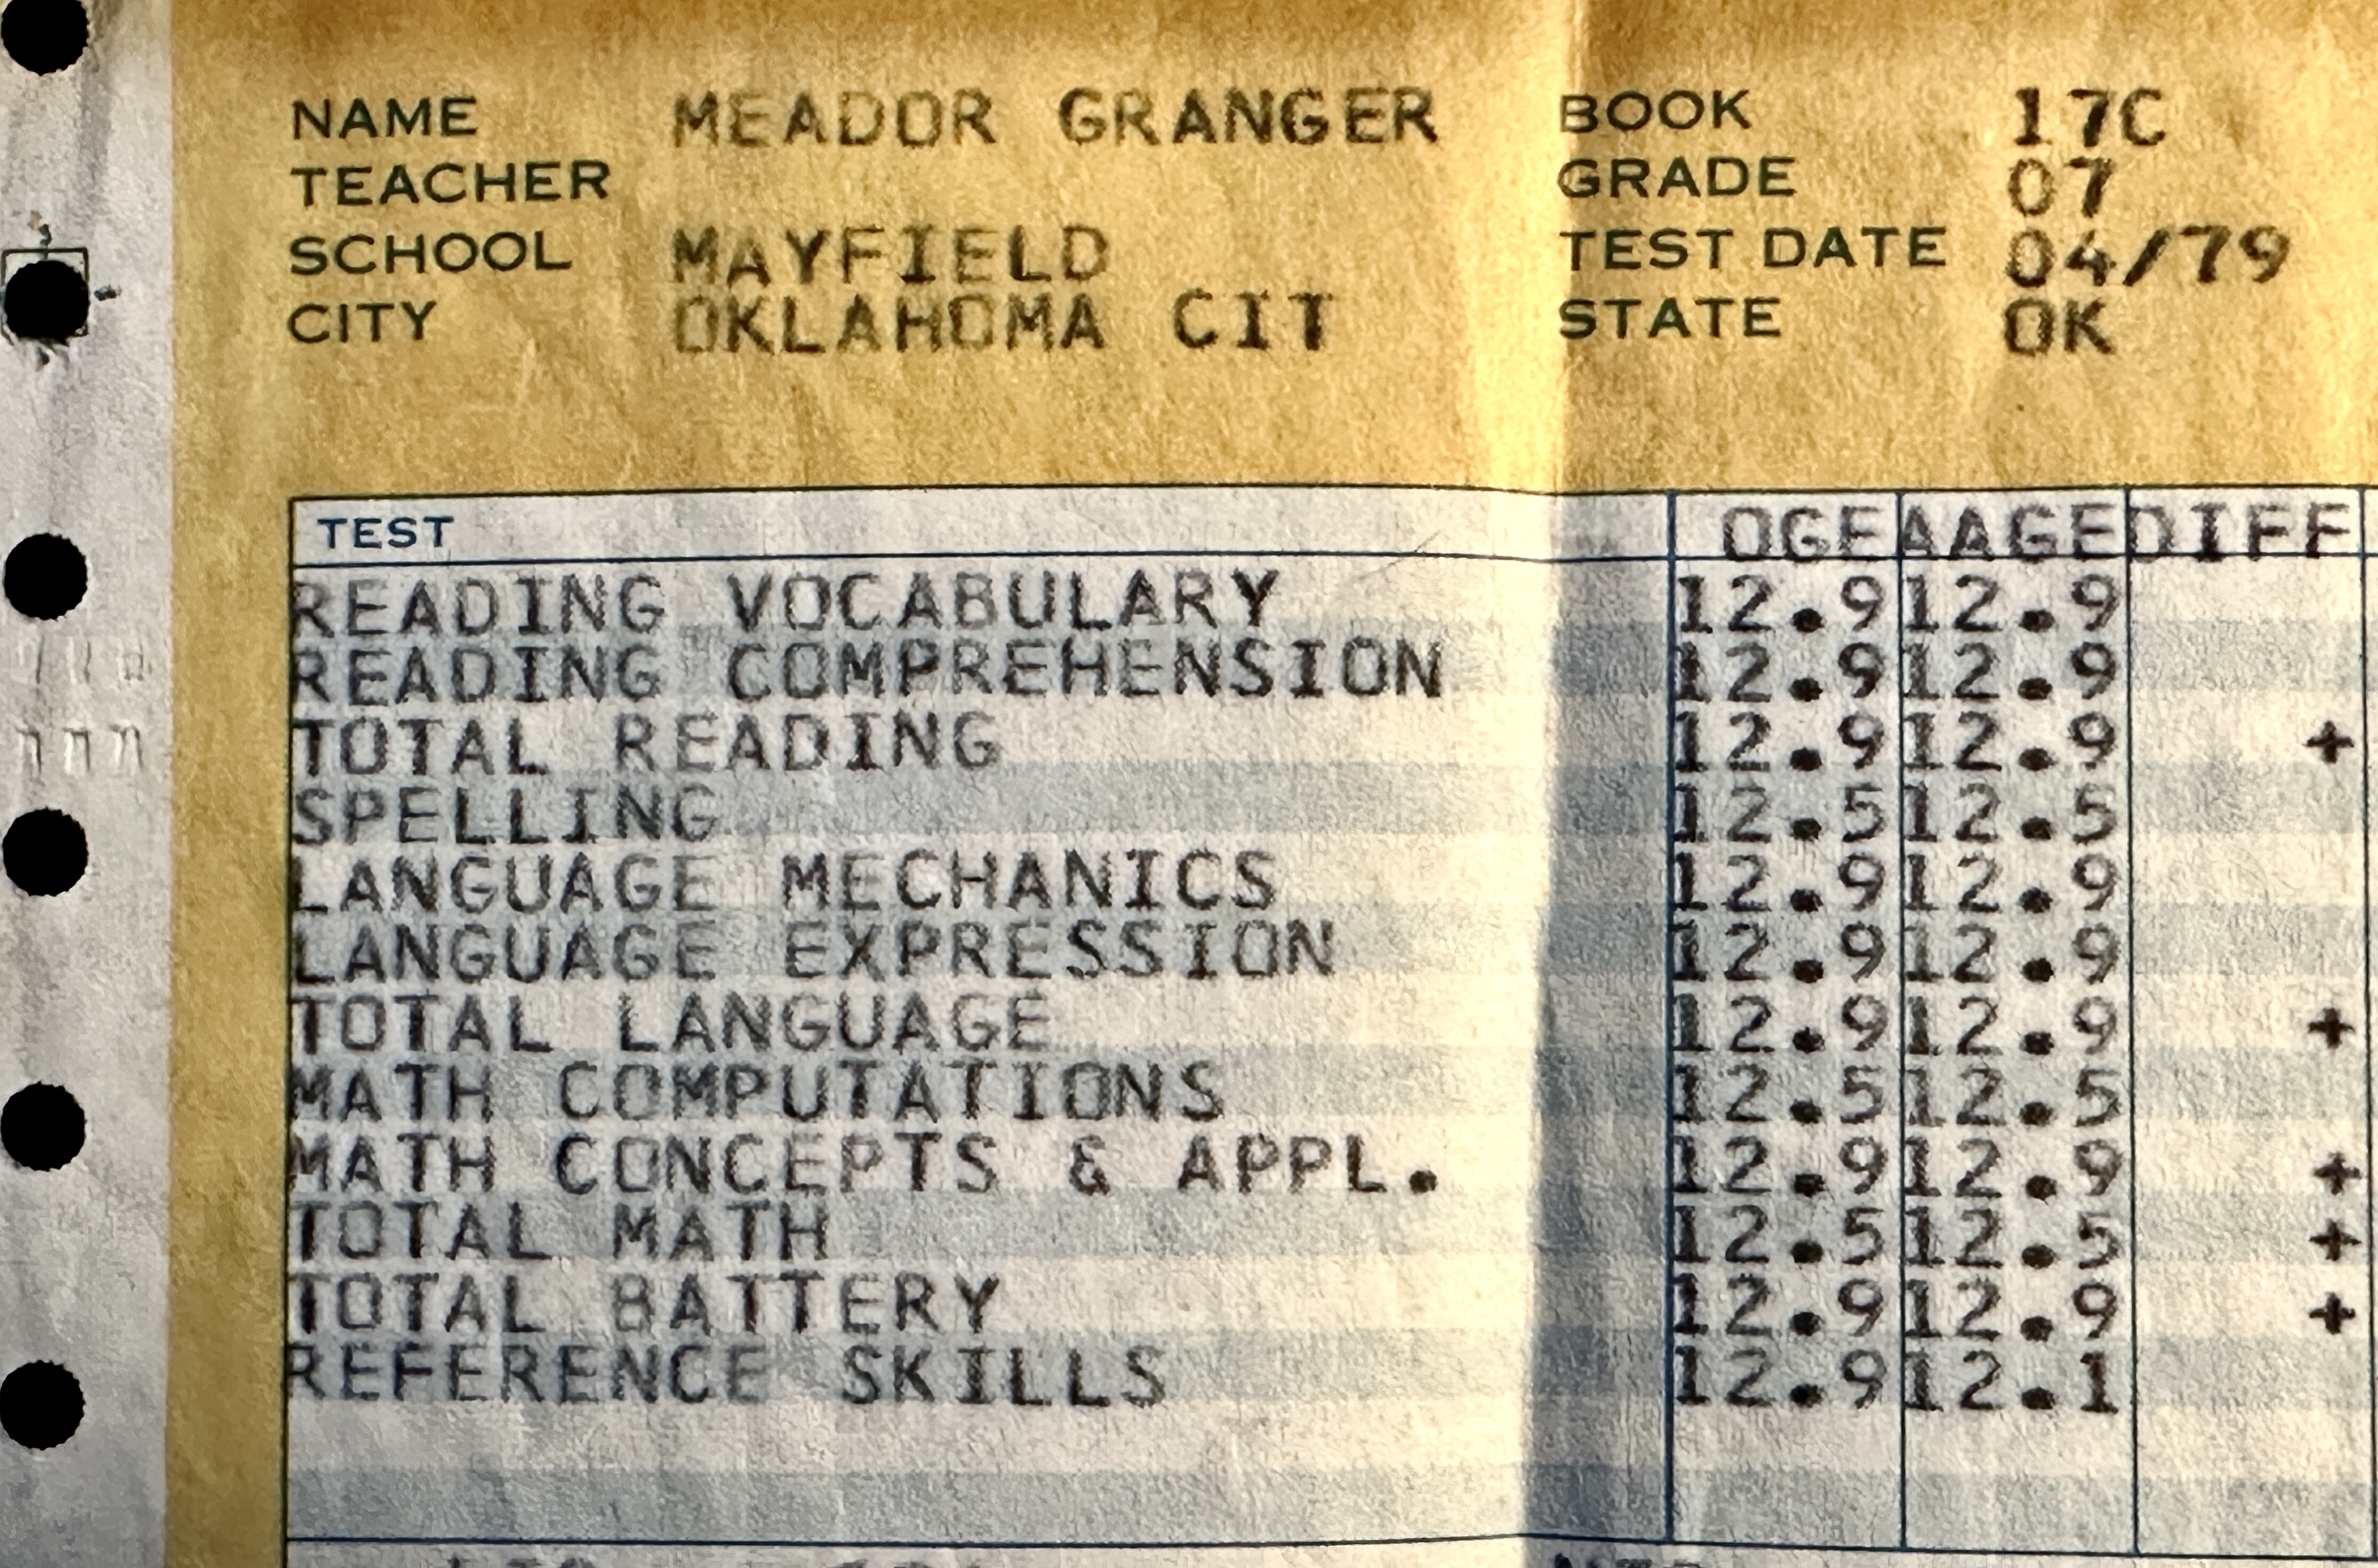
Back in 1984, Oklahoma had about 600 public school districts (it now has about 500), and about half of them gave the California Achievement Test (CAT) and the others gave the Iowa Test of Basic Skills. I took the CAT throughout my time in Putnam City Schools, and both tests were norm-referenced, comparing relative student performance to national norms, as opposed to criterion-referenced exams which show how well students have met various standards.
A Nation at Risk spurred the legislature to establish the Oklahoma School Testing Program, and it mandated ever more tests over the next thirty years. The mandates grew from norm-referenced tests in grades 3, 7, and 10 in 1985 to over two dozen different tests by 2007.

Over the years, more and more norm-referenced tests were then replaced by Oklahoma Core Curriculum Tests which were criterion-referenced. End-of-instruction tests began in seven high school subjects, with students eventually having to pass four of those tests to graduate.
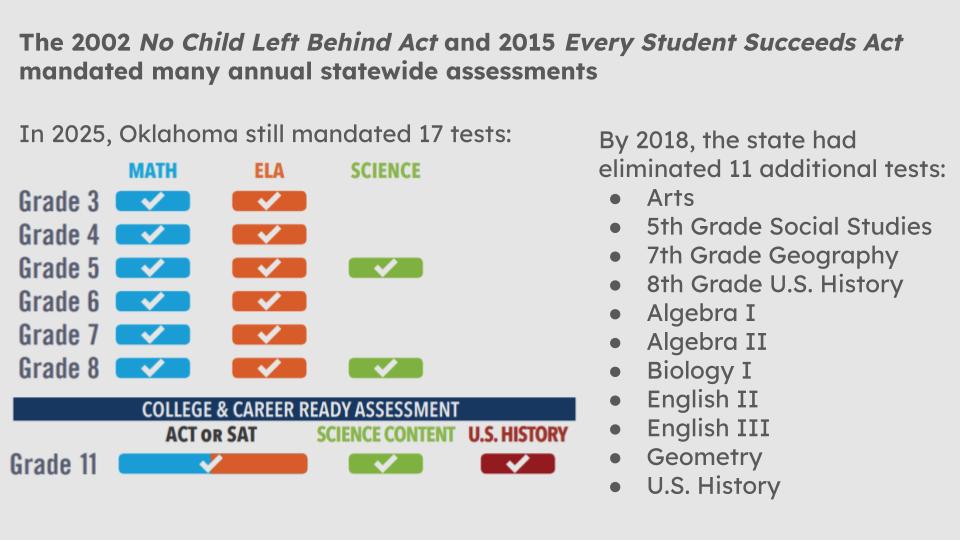
In 2002, the federal No Child Left Behind Act mandated about 16 tests across grades 3-8 plus more in high school. There was an increase in both math and reading scores on the NAEP Long Term Trends in 2008 and 2012. However, after that act was replaced in 2015 by the Every Student Succeeds Act, the legislature finally reduced the time and money spent on state-mandated testing. It had scaled back to 17 tests in 2025, with most of those required by federal law.
The NAEP scores declined in 2020 and 2022 amidst the Covid-19 pandemic. In Oklahoma, all public schools were forced to close for ten days in the spring of 2020, with virtual instruction or distance learning for the remainder of the 2019-2020 academic year. For Bartlesville that meant 33 days of virtual instruction in the spring of 2020.
Bartlesville returned to in-person classes that August, but quarantines, isolations, and staff shortages, along with inclement weather, led to 25 virtual days in 2020-2021 and 14 in 2021-2022. After that, vaccinations and the Omicron wave of infections essentially ended the pandemic emergency. However, in later school years Bartlesville and many other districts then had some planned virtual days and others for inclement weather.

Bartlesville doesn’t plan to have any virtual days in the 2025-2026 school year, anticipating a near-total ban on them in public schools statewide starting in 2026-2027. Things seem likely to return to just some school day cancellations for inclement weather.
It is enlightening to see how the oodles of state-mandated tests, higher standards, and various other reforms after 1982 in the end only yielded a 3% increase in age 9 reading scores and 2% increase for age 13, with all of those gains erased by the pandemic. Math scores showed a bit more lasting improvement, peaking with increases of 11% for age 9 and 8% for age 13 in 2012, but now those have declined to 7% and 3% respectively. In my opinion, the slew of mandates from A Nation at Risk, No Child Left Behind, and the Every Student Succeeds Act had only a limited effect on outcomes while the endless criticism and controls they promulgated exacerbated a nationwide teacher shortage that is especially acute in Oklahoma.
Student poverty
Three factors that we know have an impact on statewide achievement scores are student poverty, per pupil spending, and teacher quality. I’ll illustrate the first of those factors by having you ponder this chart of the NAEP 8th Grade Reading scores over time for our region.

Why is Colorado at the top and New Mexico the bottom? I’d say the most significant reason is because they occupy the opposite extremes when you chart the percentages of children living in poverty.
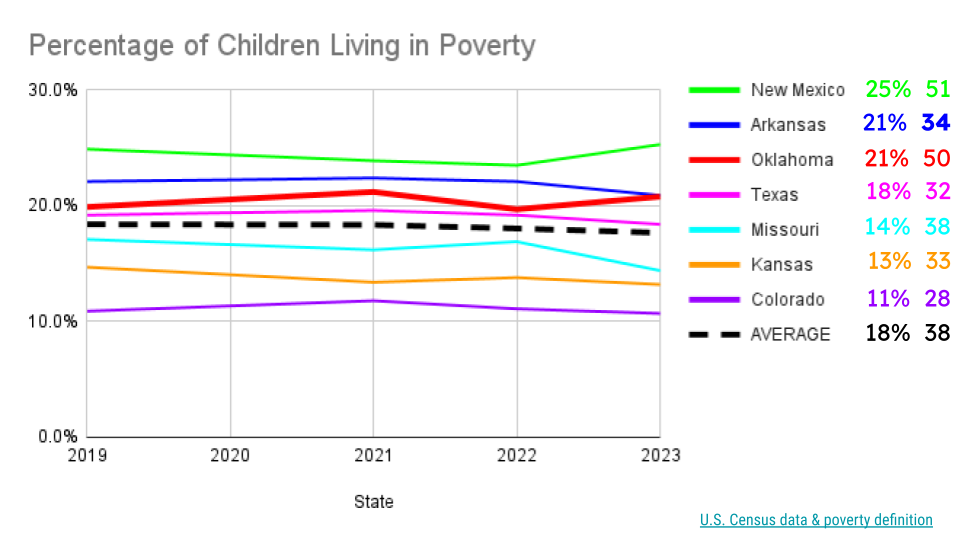
However, child poverty is not destiny when it comes to a state’s school rank. The outlier in the poverty chart is Arkansas. It usually had more of its children living in poverty than Oklahoma, yet it was ranked 34th in WalletHub 2025, while we ranked 50th. Perhaps Arkansas is investing a lot more in its public schools, or it has measures that drive better outcomes. Let’s first check the regional per pupil expenditures.
Per pupil spending
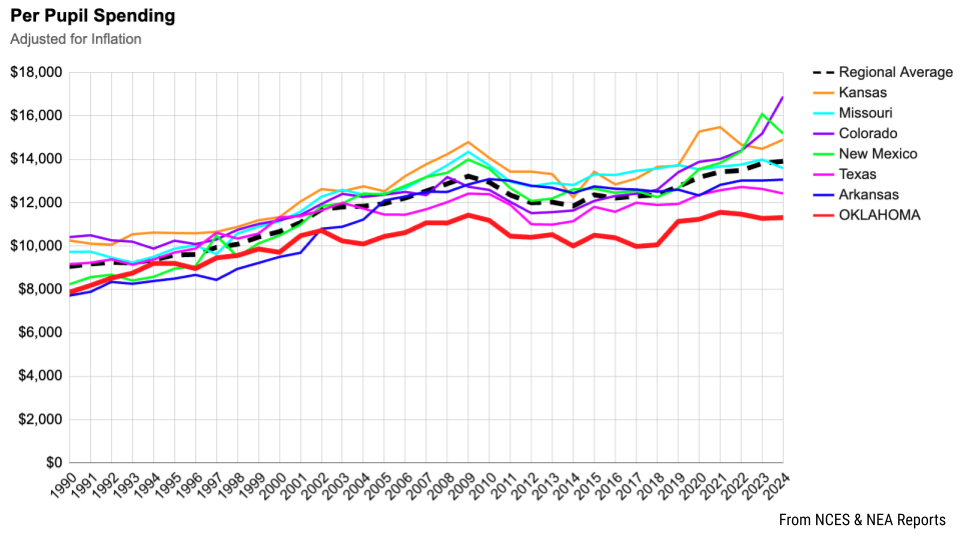
That chart is adjusted for inflation, so the region increased its real per pupil spending by over 50% during my time in Bartlesville, while Oklahoma’s only grew by about 33%, and Oklahoma’s spending fell away from the group after 2002 for a reason I will identify below.
Per pupil spending is not destiny, either, when it comes to school rankings. In the 1990s, Oklahoma outspent Arkansas, but that changed after 2002. Arkansas has certainly invested more in its students than Oklahoma for over 20 years, but it has spent less than the regional average since 2020 yet its ranking is above average for the region. Also notice how New Mexico has dramatically increased its per pupil funding in recent years, yet its school systems are still ranked dead last by WalletHub. Money alone can’t solve New Mexico’s problems, and I presume Arkansas benefits from some policy and/or demographic differences that raise its rank, although I haven’t been able to tease those out from the data.
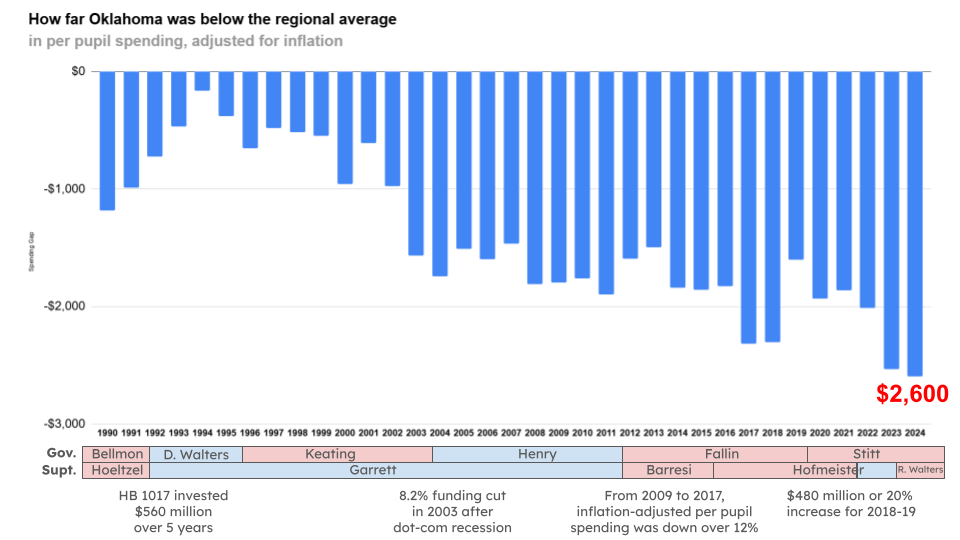
However, we certainly can’t ignore Oklahoma’s outlier status in low per pupil spending since 2003. Here’s a chart of its per pupil spending as a percentage of the regional average with some helpful annotations to explain the salient features.

Taxation
The dramatic rise in spending in the early 1990s was due to House Bill 1017, the most significant education reform law in state history. It lowered class sizes, improved salaries, introduced curriculum standards and testing, and…raised taxes. That’s never popular in Oklahoma, and led to a failed attempt to repeal the law in 1991 and then to State Question 640 in 1992, which made it nearly impossible to raise state taxes. I knew at the time that was a ticking time bomb in the state’s finances. It took about 11 years for it to detonate.
SQ 640 requires that tax increases be approved by a vote of the people or by 75% supermajorities in both legislative chambers. Each method only succeeded once over the following 33 years. In 1994, voters approved a state question that increased tobacco taxes. However, when the dot-com recession hit in the early 2000s, the legislature couldn’t muster the 75% supermajority votes to raise taxes to compensate. So it slashed public school funding by over 8% and the state’s per pupil spending stayed in the mid 80% range for a dozen years, including during and after the Great Recession from December 2007 to June 2009.
Governors and legislators repeatedly cut state income taxes after SQ 640 was passed, which exacerbated the danger of state revenue shortfalls whenever a sharp economic downturn arrived, particularly given the volatility of the petroleum industry.

Such cuts are heavily weighted toward the wealthy. Below are the average tax cuts by income level in 2016 after a decade of tax cuts.

By 2016, the state suffered dramatic mid-year revenue shortfalls. In Bartlesville, we had to cut 39 positions, including 21 teaching positions, which was 5% of the overall teaching workforce, plus over 20% of the district-level administrators. Average class sizes jumped to levels once banned under HB 1017.
Voters rejected a 2016 state question that would have increased the state sales tax by one penny to help out the schools. However, Bartlesville voters did approve a bond issue to absorb as many of its schools’ operational costs as possible, with limitations given how it is illegal in Oklahoma to pay for salaries or consumable goods with bond issue funding. Shifting about $700,000 in annual operational costs to bond dollars allowed the district to avoid cutting another 15 teachers, but things were at a low ebb.
In 2018, state legislative leader Earl Sears and I devised a tax increase package and Bartlesville Public Schools led a statewide school suspension movement that pressured the legislature into finally achieving 75% supermajority approval in both of its chambers to increase gross production, fuel, and tobacco taxes. That increased state funding for schools by 20%, with most of the money going to salary increases for teachers and support staff to try and slow a growing shortage of qualified teachers, who had been abandoning Oklahoma for better salaries and working conditions in adjoining states.
Even with that historic investment, Oklahoma’s per pupil funding remained the lowest in the region. Unfortunately, the legislature soon returned to cutting sales, corporate, and income taxes. So-called flat budgets for schools consequently eroded our regional per pupil spending percentage back to record lows by 2024.
Below is a look at the inflation-adjusted spending gap: how much less Oklahoma spends per pupil than the regional average.
It simply wasn’t like that when I was a student in Oklahoma’s public schools in the 1970s and early 1980s. Let me illustrate by broadening the view out to Oklahoma’s per pupil funding rank among the 50 states and the District of Columbia from 1970 to 2024.

When I was an elementary school student in the 1970s, the state’s per pupil spending oscillated, but averaged about 42nd out of 51. The late 1970s and early 1980s oil boom allowed that to balloon to about 30th when I was in junior high and high school. However, the oil bust in the mid-1980s led to a dramatic drop while I was in college. Our spending dropped from 33rd in 1983 to 46th by 1989 when I started teaching in Bartlesville. That huge drop is what propelled the House Bill 1017 education reform law and its tax increases.
Funding alone can’t ensure better student achievement or higher overall school rankings, but Oklahoma’s outlier status of having the lowest per pupil funding in the region for over 20 years has crippled its ability to recruit and retain highly qualified teachers. Fifteen years ago, emergency certified teachers were a rarity in Oklahoma. By the budget crises of 2016-2018, 5% of its teachers lacked proper certification. Since then that has more than doubled. A key focus of the 2002 No Child Left Behind Act was to have a “highly qualified teacher” in every classroom. Oklahoma’s political leadership has simply abandoned that goal, keeping school funding flat while emergency certifications continued to climb.

For the past few years in Bartlesville, about 1 of every 7 teachers has been emergency certified, with a corresponding impact on the quality of instruction.
The state recently eliminated its sales tax on groceries, something crowed about by both Democrats and Republicans in the legislature. That brought our sales and excise taxes to the lowest in the region save for Missouri, which has much higher property and income taxes. That dubious cut, corporate tax cuts, and 10 cuts in personal income taxes since 2003 have left Oklahoma with the lowest tax burden in the region…and woefully underfunded schools, health care, roads, and other services.

The state’s politicians continue to bemoan our personal income taxes, even though they are now the second lowest in the region, because they aren’t zero like Texas. They conveniently ignore that Texas compensates for a lack of income tax with property taxes that are 2.25 times higher than Oklahoma’s, along with higher sales and excise taxes.
Why, since Oklahoma’s per pupil funding is so dire, haven’t teachers risen up like they did back in 2018? Because their salaries aren’t low enough yet in relation to adjoining states, and they would be vilified by the state’s current political leadership.

Back in 2016-2017, Oklahoma’s teachers salaries were the lowest in the region. In 2024-2025, they were below the regional average but still above Missouri, Kansas, and Arkansas. So teachers and boards of education don’t have enough incentive to mount another difficult campaign to improve the situation and bolster record-low per-pupil spending via some sort of tax increase.
Things will inevitably take a turn for even worse in the next moderate or significant economic recession. In 2024, the legislature’s own LOFT budget stress test showed, “Oklahoma’s State Budget is not prepared to manage the effects of a moderate downturn with only its current reserves”. The study pointed out that states should hold at least 15% of prior year spending in their reserves, and states like Oklahoma that are more reliant on volatile sources of revenue should exceed that. However, Oklahoma had only 12% in reserve, and it would need a 25% reserve to cover the projected impact of even a mild downturn.

Oklahoma has only raised taxes twice in the past 33 years while repeatedly cutting various revenue sources. That has reduced the tax burden from 9.5% of personal income in 1995 to 7% in 2025 as its public schools foundered.
Given the state’s conservative politics, I don’t expect Oklahomans to significantly increase their investment in their own quality of life with meaningful spending increases on schools, health care, roads, or other state services. Thankfully there are some communities, such as Bartlesville, that are willing to pass bond issues and sales taxes to invest in their schools and their city services, but such efforts can only go so far. That reality makes the conclusion of my career in Oklahoma’s public schools both welcome and bittersweet.


Mr. Meador,
I appreciate the time and effort you put into this article. It’s an enlightening analysis of Oklahoma’s current school situation.
I’m a previous student of yours. I still remember Fluffy the cat! Thank you for the exceptional teaching.
Amy C
Amy, you’re most welcome. Fluffy and I send you our warm regards!