The exposure of workers to job displacement by artificial intelligence (AI) has been a topic of interest for several years. Sam Manning & Tomás Aguirre of The Centre for the Governance of AI, joined by Mark Muro and Shriya Methkupally of Brookings Metro, have charted such exposure against workers’ adaptive capacity, i.e. their ability to navigate job displacement. The result is a measure of overall occupational vulnerability to AI disruption. Their work has been shared in a September 2025 PDF as well as a January 2026 online report.
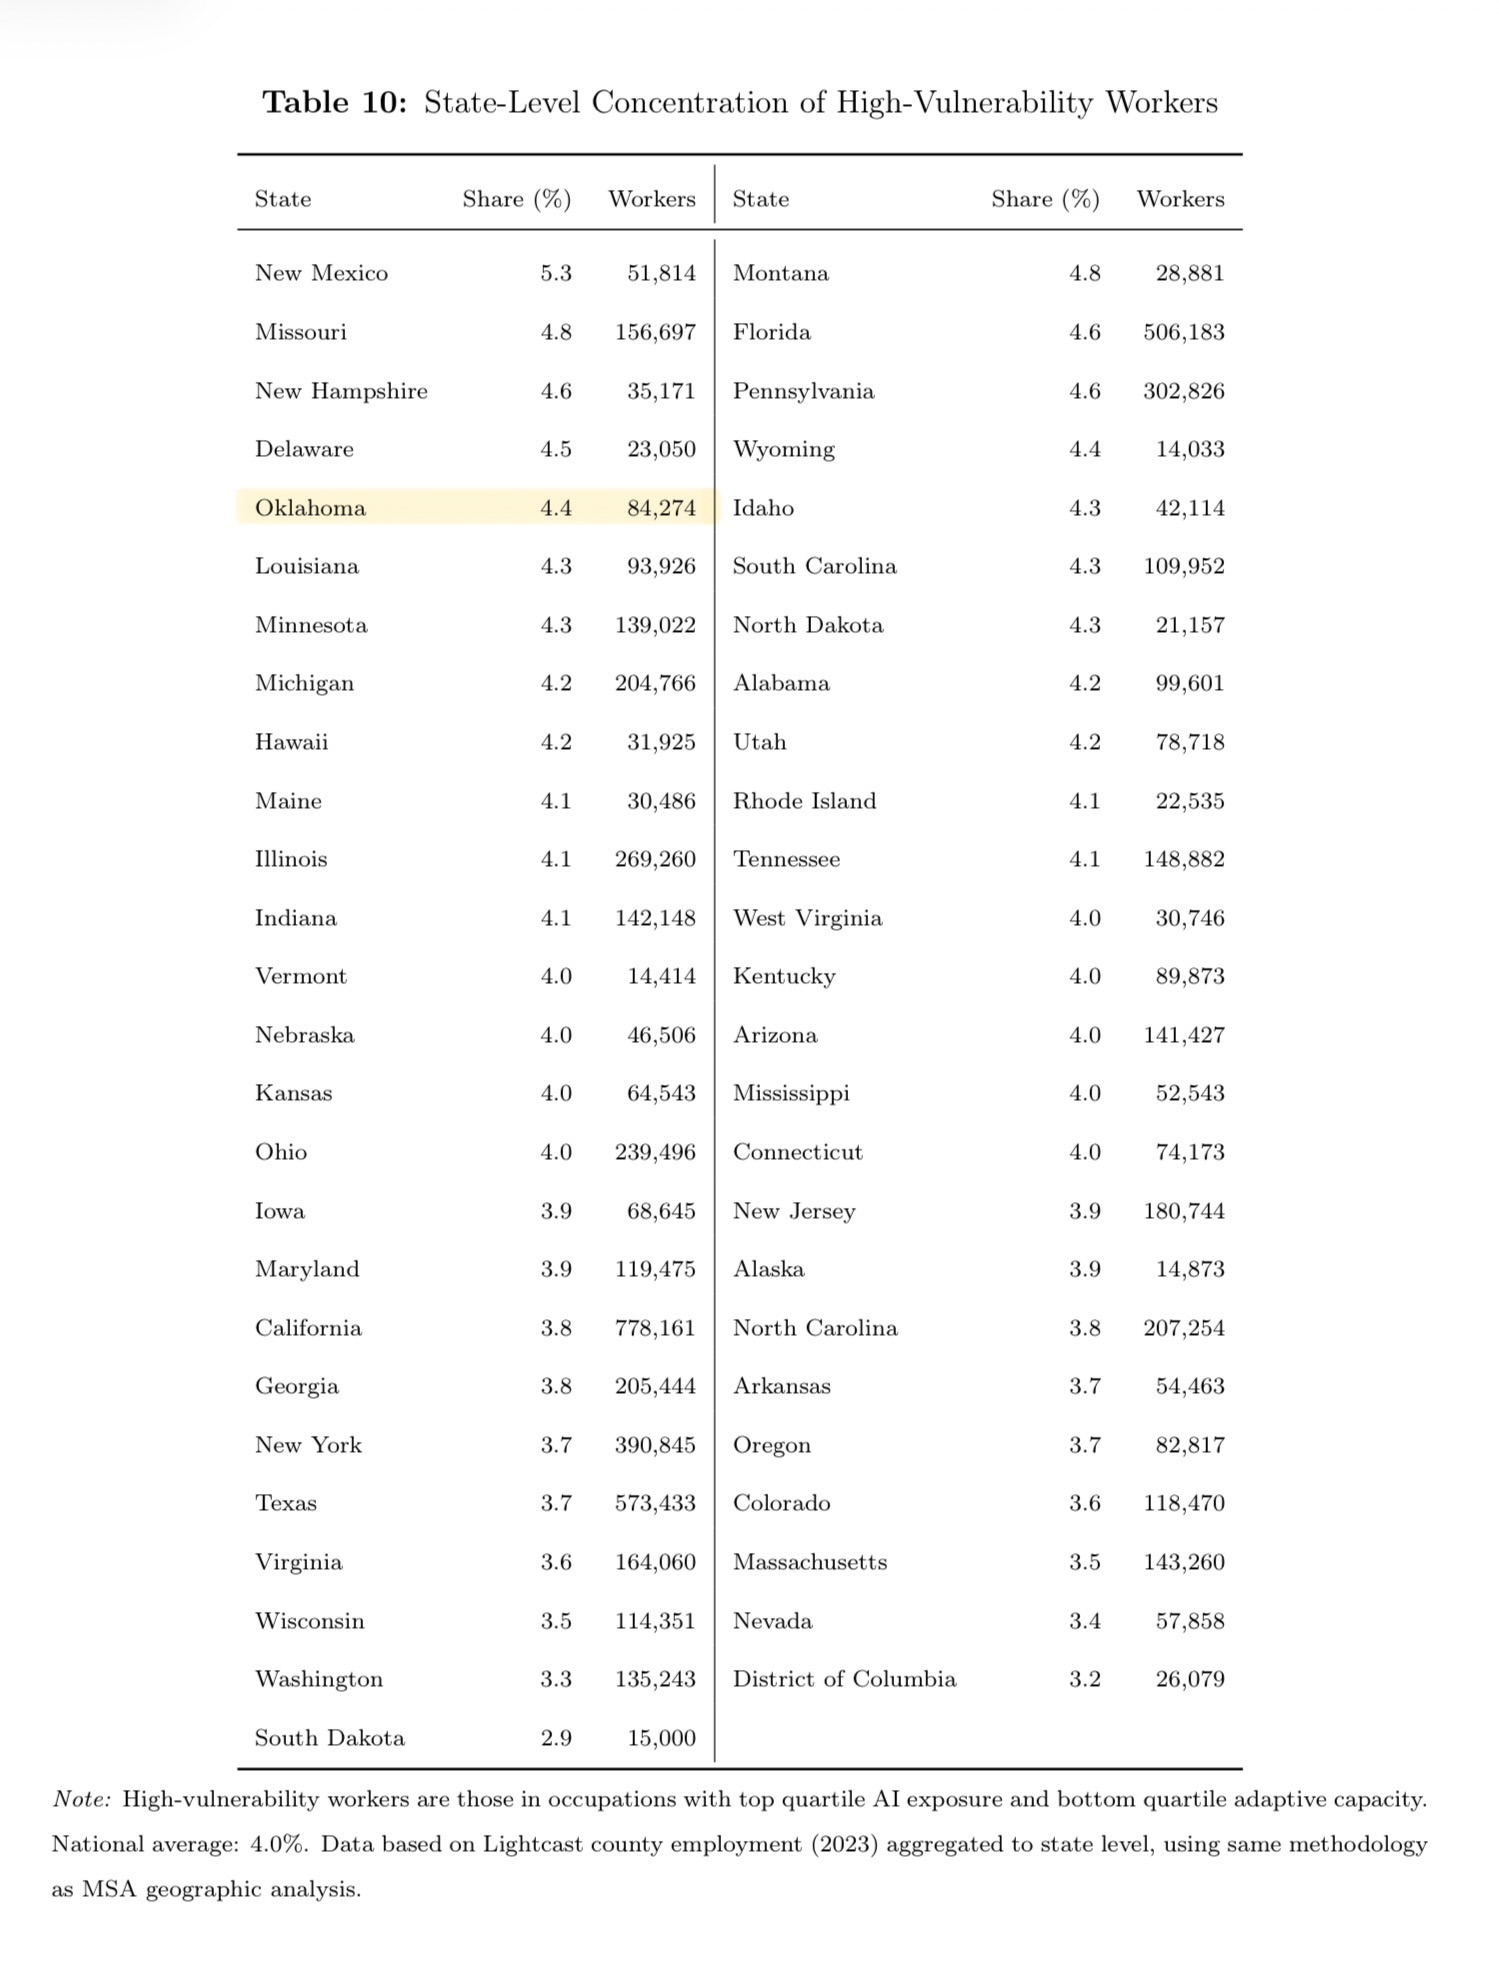
Oklahoma was found to be in the top ten states with the greatest concentration of workers highly vulnerable to job disruption by AI. The Sooner State has 84,274 folks, comprising 4.4% of its workforce, who are in the top quartile of AI exposure and bottom quartile in adaptive capacity.
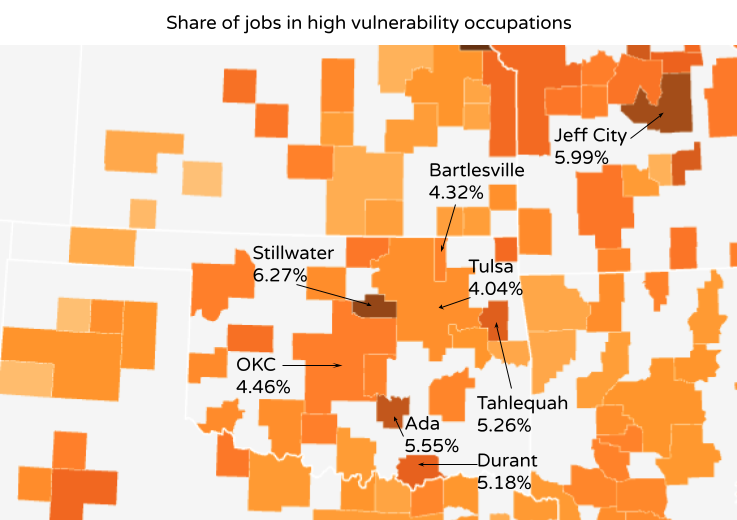
Two of Oklahoma’s metropolitan statistical areas were among the top 40 nationwide in the share of workers in high-vulnerability occupations: the college towns of Stillwater and Ada.
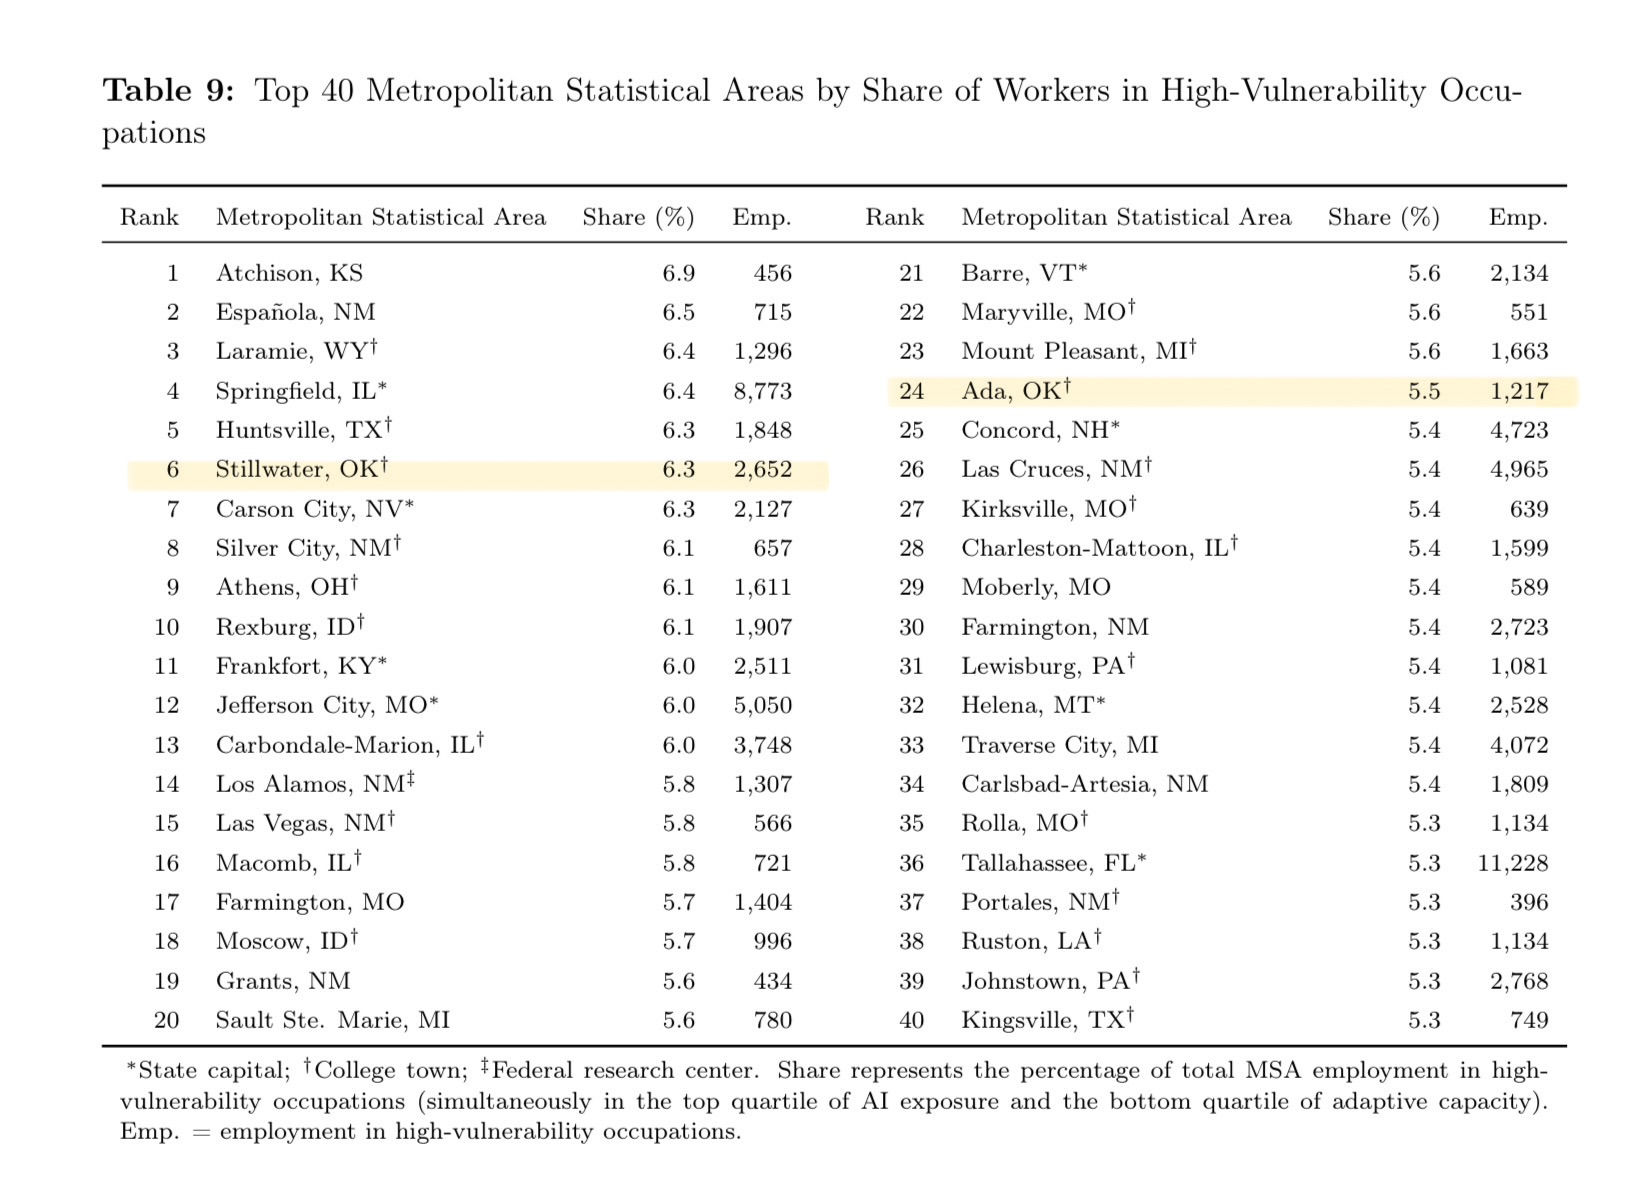
College towns, state capitals, and small towns in New Mexico and Oklahoma have the highest vulnerability shares in the study due to their “concentrations of administrative and clerical positions supporting institutional employers like universities, state government offices, and regional service centers.”
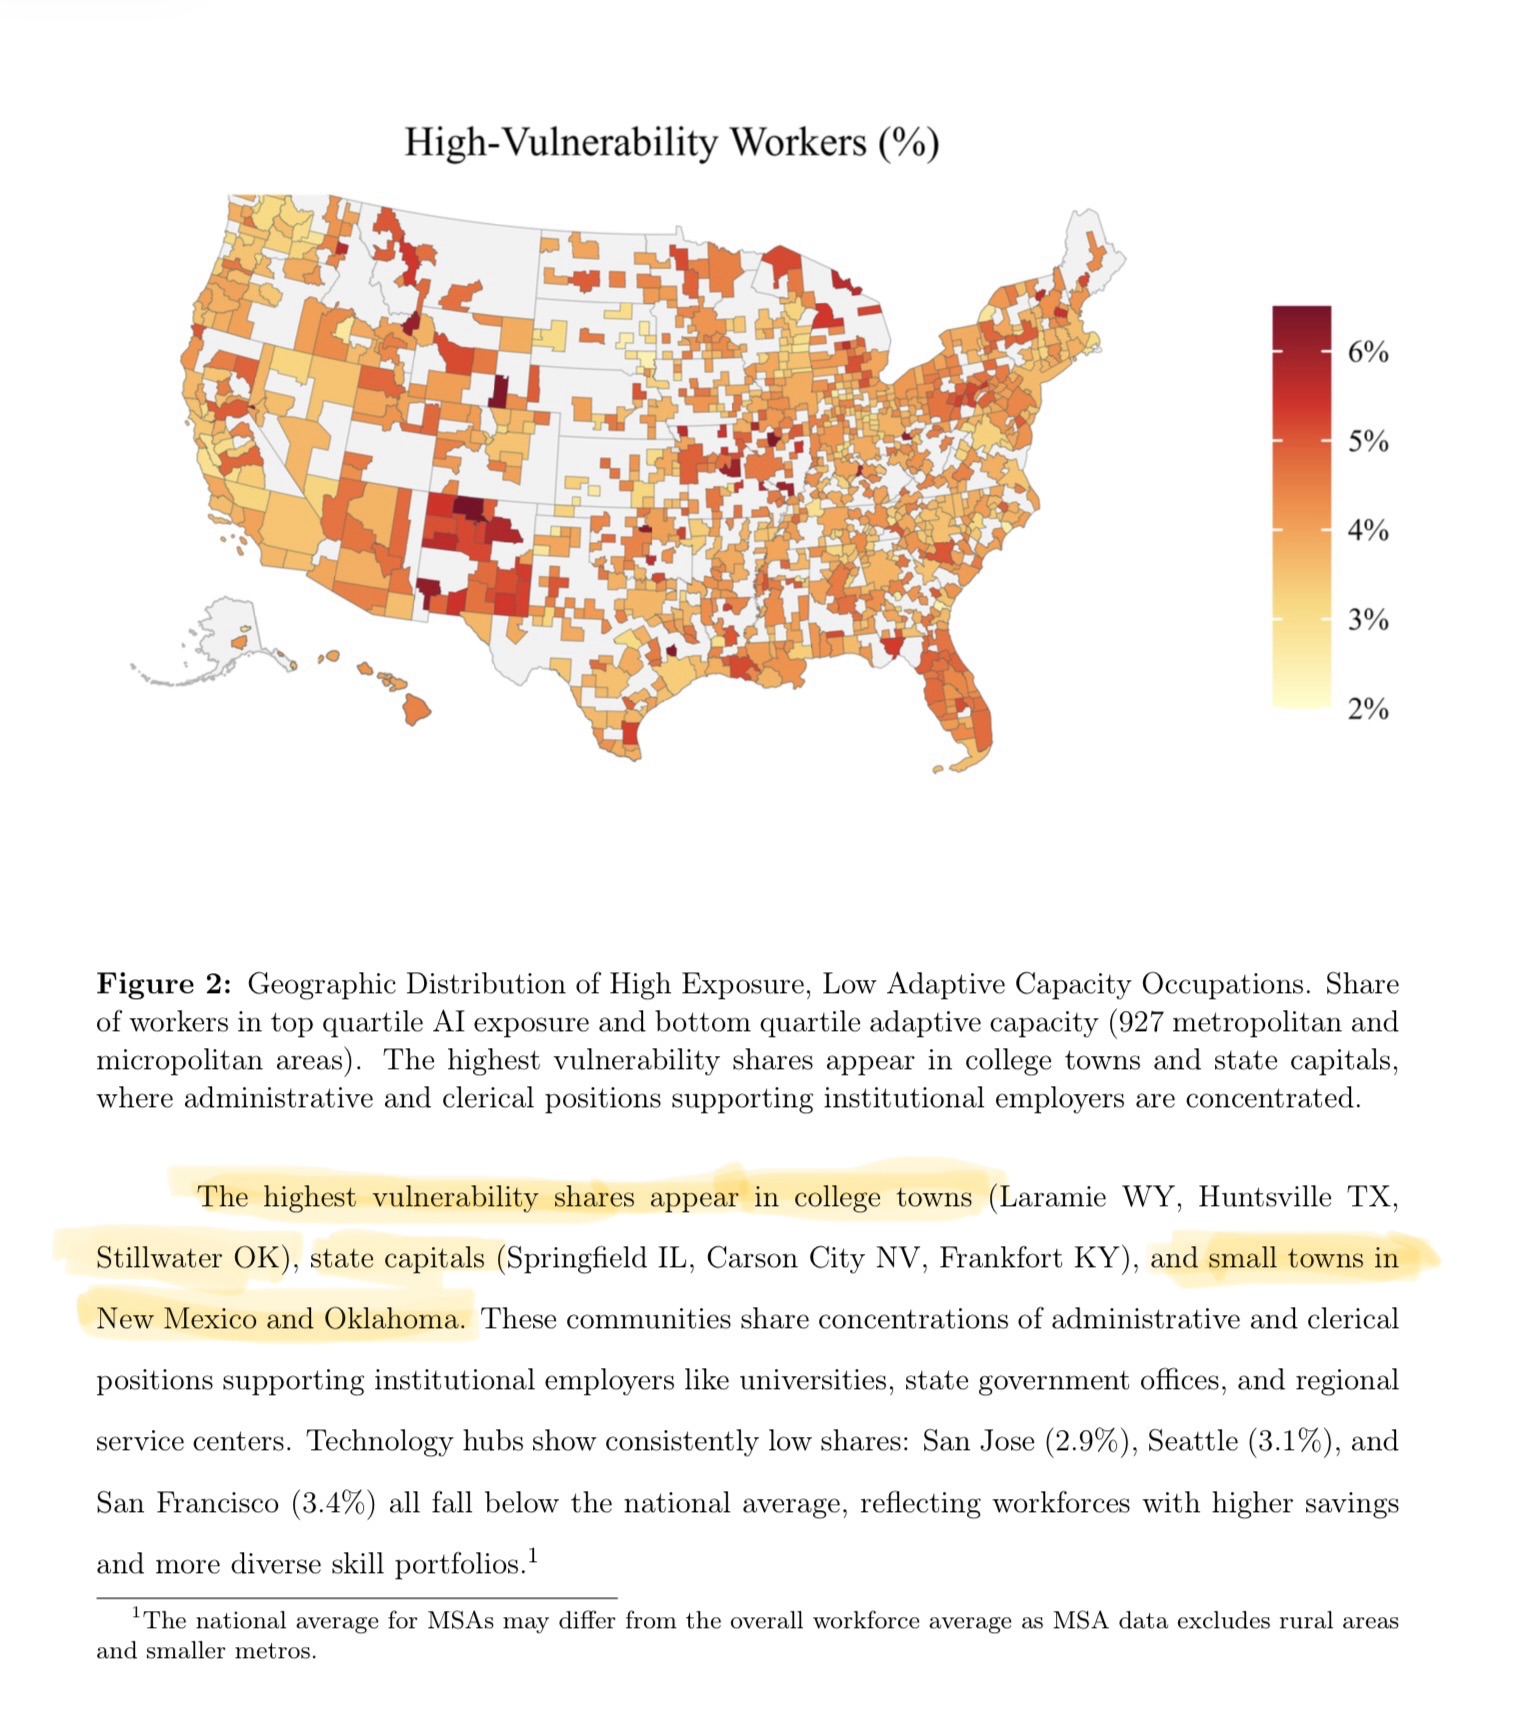
You can access an interactive version of that map of 927 metropolitan and micropolitan areas showing the shares of workers in the top quartile for AI exposure and bottom quartile for adaptive capacity among 356 occupations. 6.1 million workers nationwide fall into that category of high vulnerability. The Bartlesville micropolitan area has 4.32% exposure.
A scatterplot of adaptive capacity versus AI exposure by occupation is available in interactive form, with the size of the dots proportional to each occupation’s total nationwide employment.
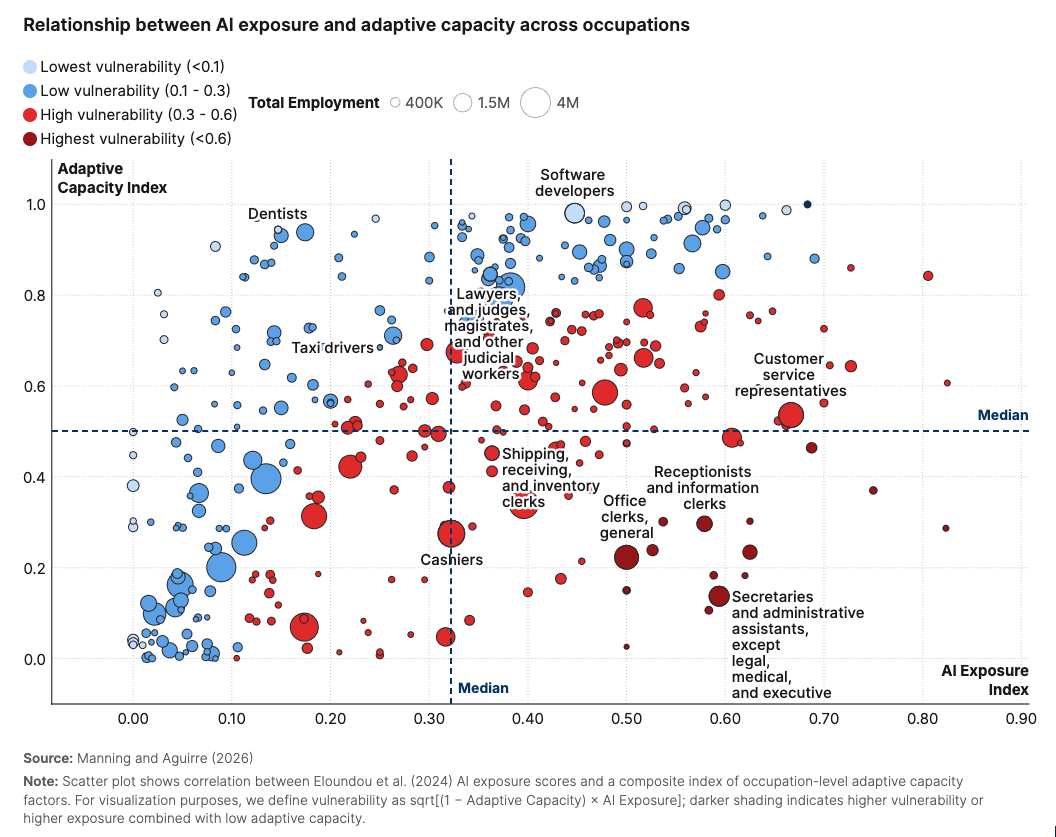
Table 6 shows occupations that face little threat of disruption by AI, while those in the occupations listed in Table 7 are highly vulnerable.
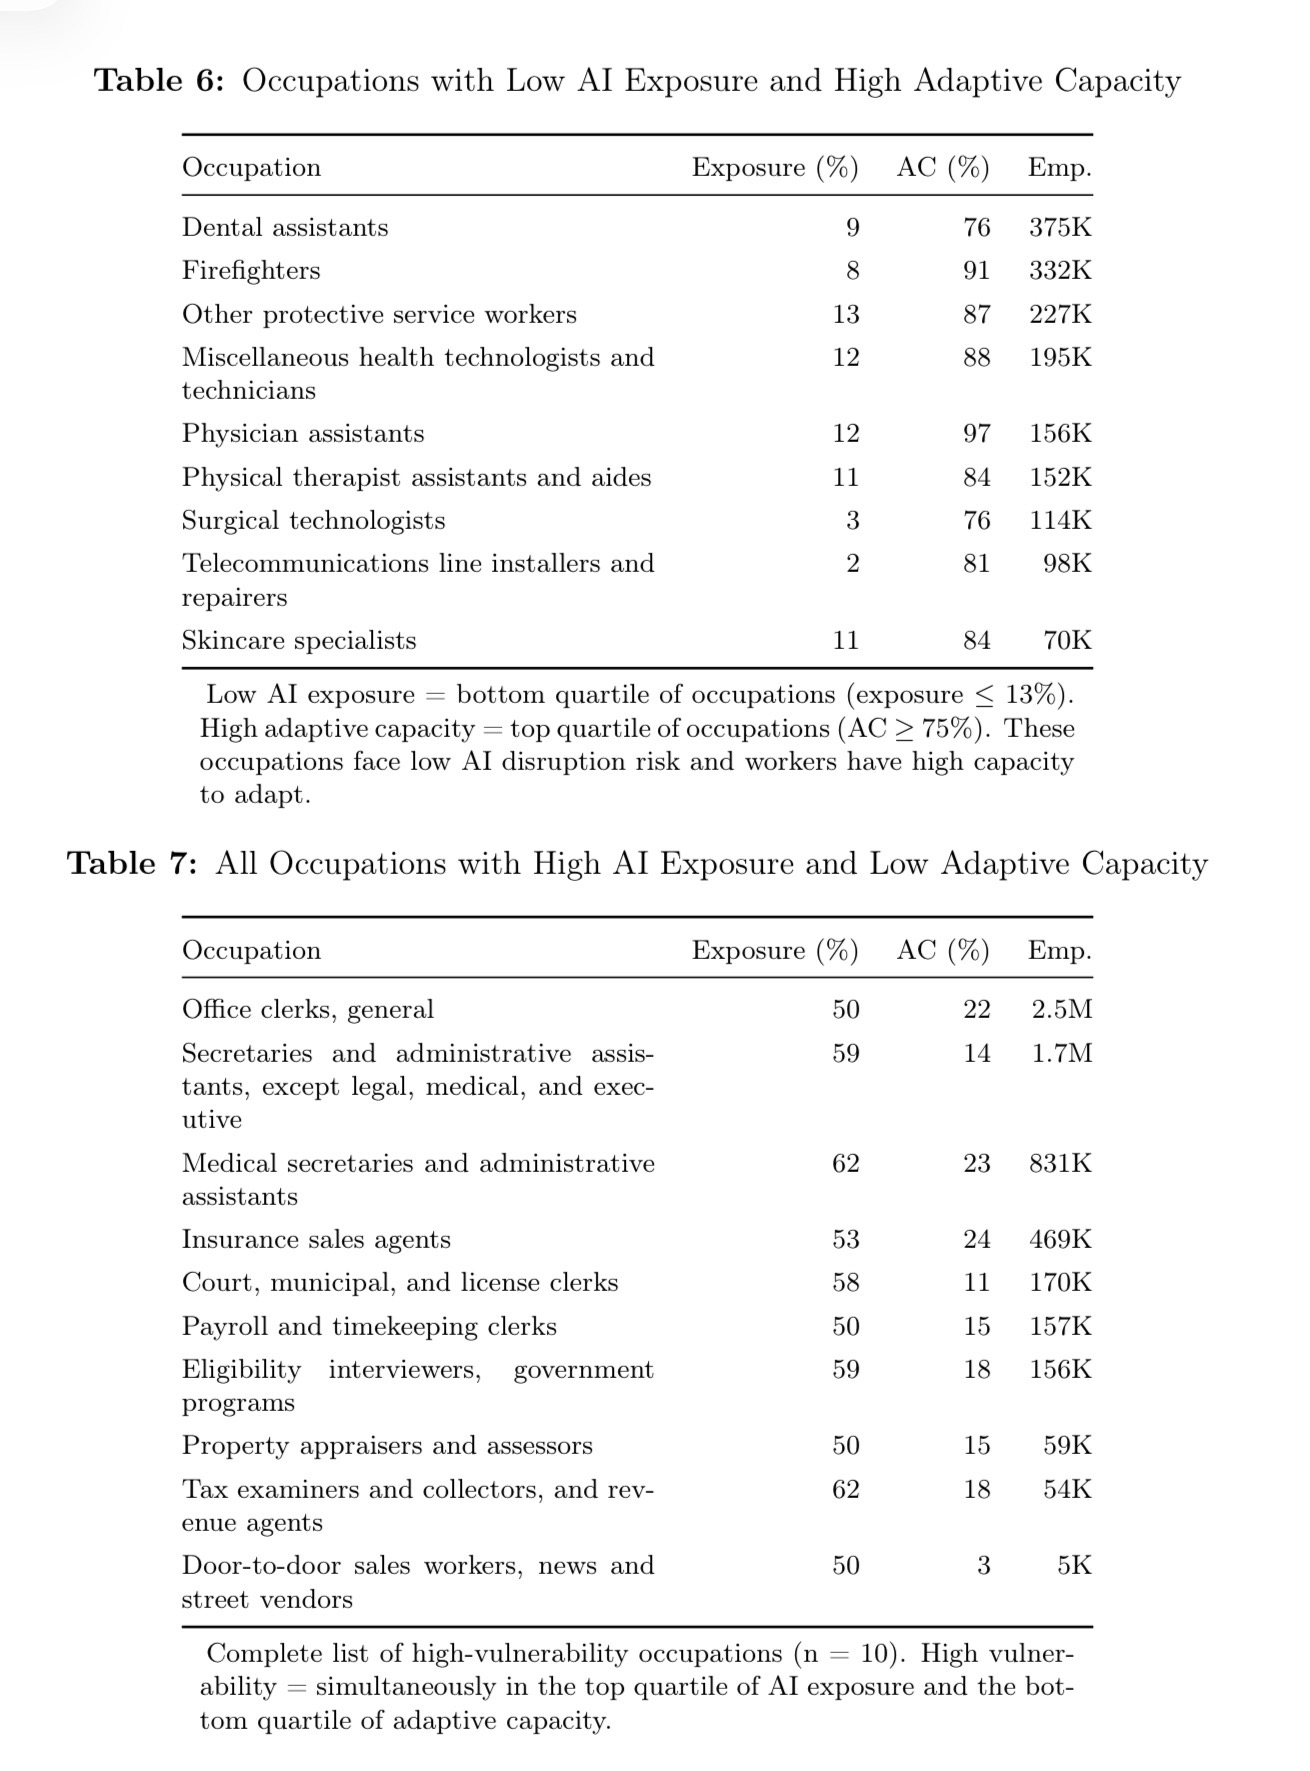
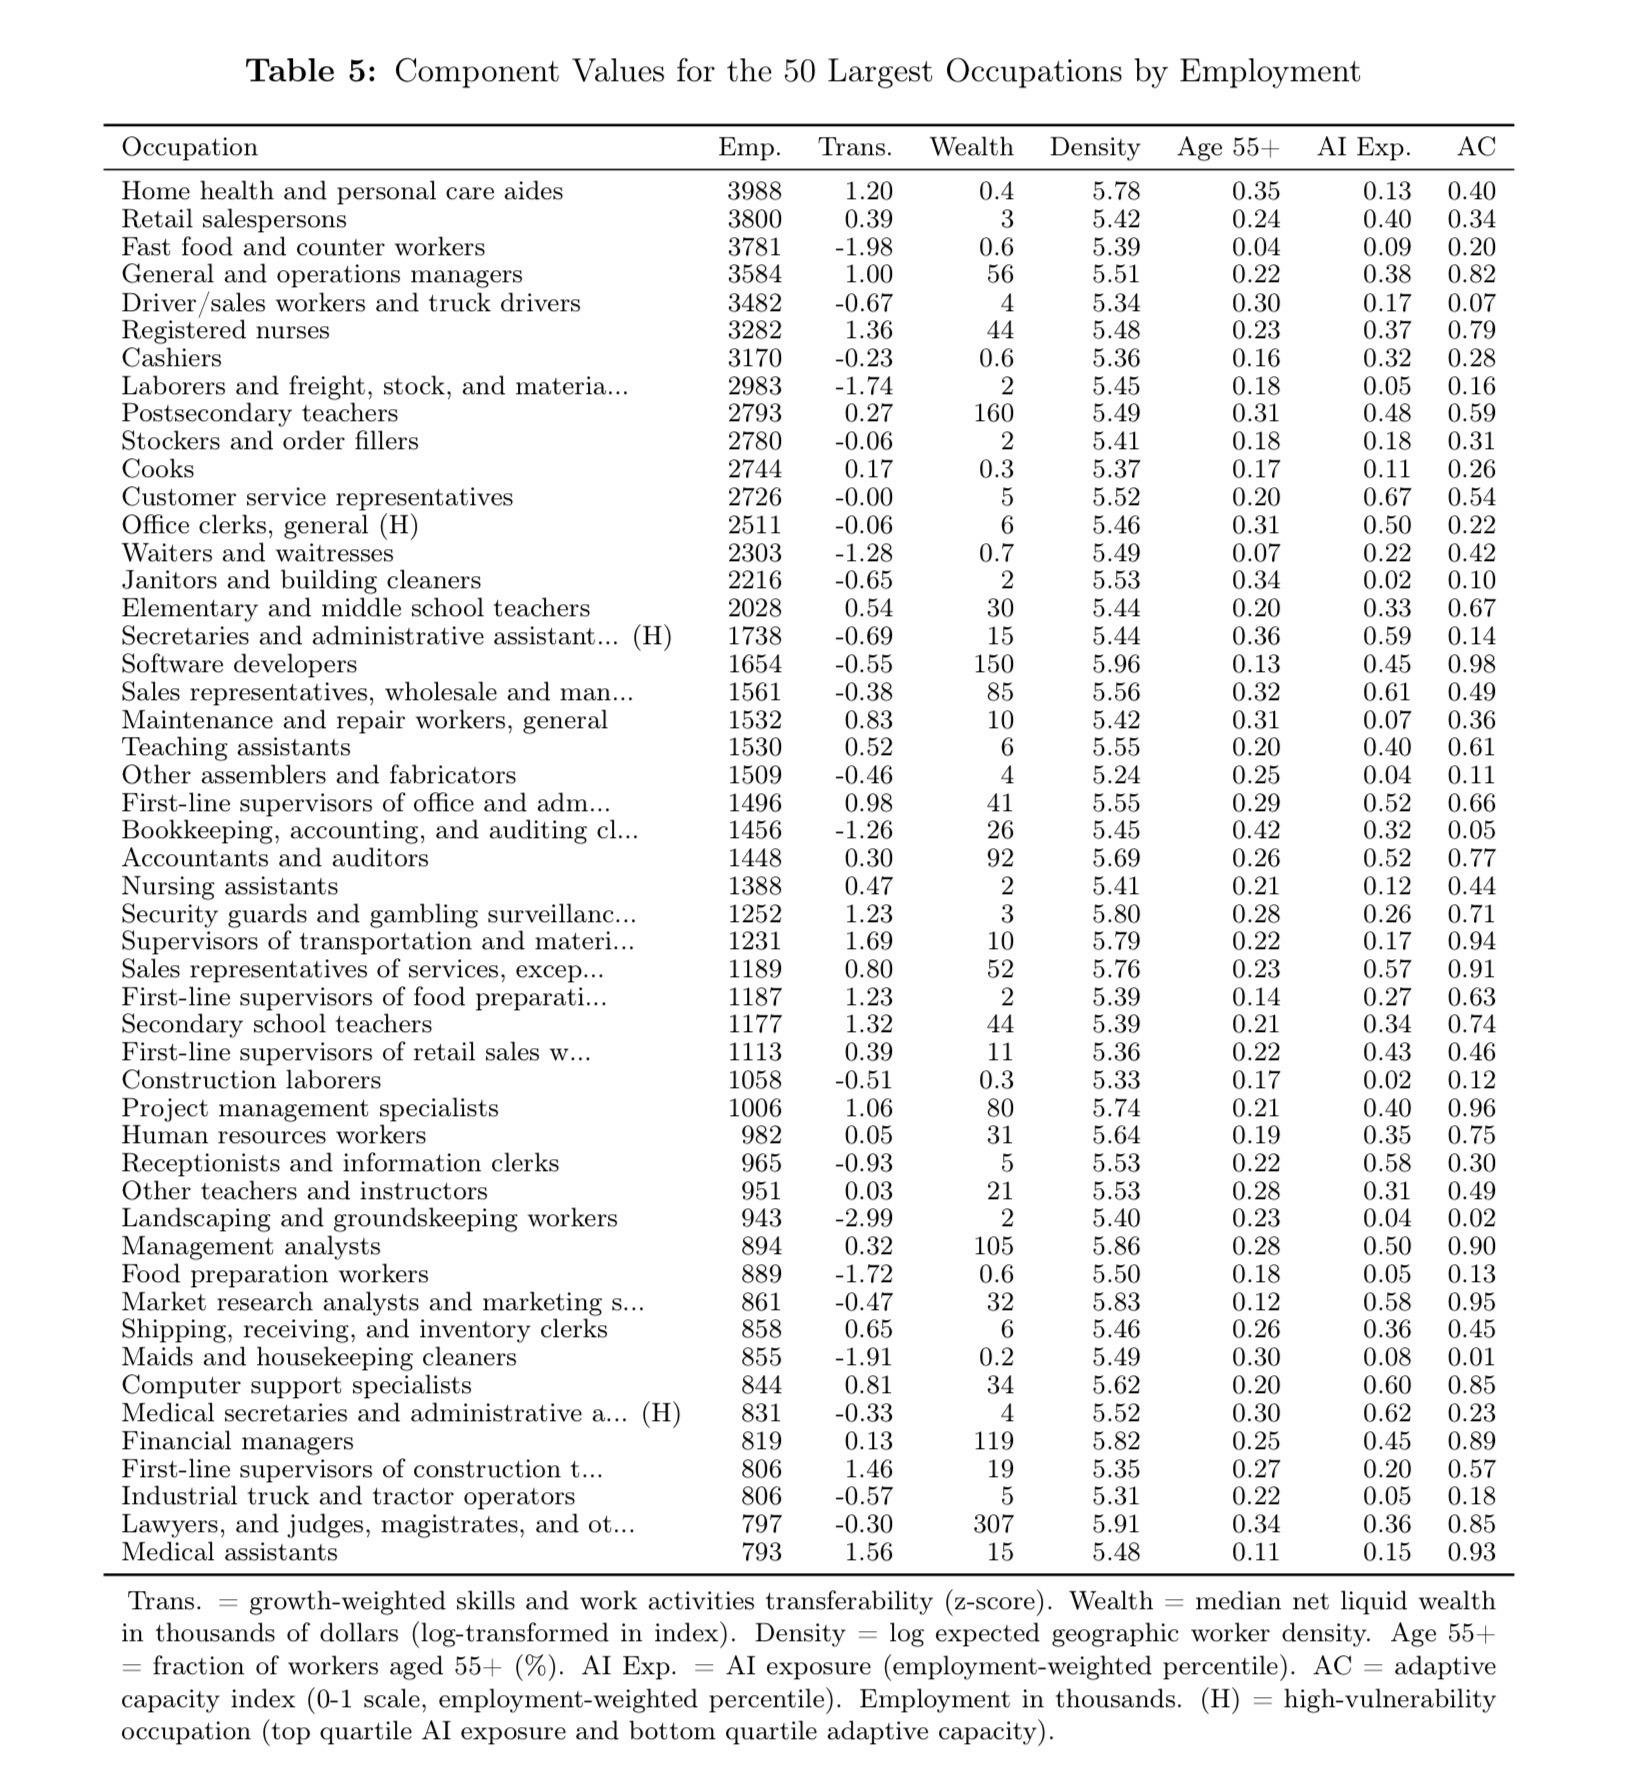
Table 5 shows the 50 largest occupations by employment. Pay attention to the final two columns. High “AI Exp.” and low “AC” indicate high vulnerability.