

Reading maps was a skill they once tested in a final section of the standardized tests I took in grade school in the 1970s. That section of the tests always struck me as ludicrously simple, as I had grown up poring over road maps on our automobile journeys.
My parents kept a pile of road maps in the glovebox of the car. Each year we would stop at a tourist center and get the latest state map, and I enjoyed spotting changes as the road network evolved. I would also compare the population figures for various cities to see if they had changed.
I moved to Bartlesville in 1989, and one aspect of its history which interests me is how the city grew rapidly in the 1910s and 1950s but has grown relatively little since 1980.

I will use that as a way to illustrate the map resources I have collected about the Bartlesville region, how you can access them, and provide tips on how you might search for similar resources for areas that interest you.
Early Maps
If you are lucky, you might find an old panoramic map. Thaddeus Mortimer Fowler of Fowler & Kelly of Passaic, New Jersey published such a map of Bartlesville in 1917, near the end of its early growth spurt.

Fowler was known for his panoramic maps, and the Library of Congress has an extensive collection of his and others’ works. There is a page that lets you search them by state, and for Oklahoma they had Guthrie in 1890, Ardmore, Fort Reno, and Edmond in 1891, and Tulsa in 1918, along with the 1917 one of Bartlesville.
I have annotated the 1917 panoramic map in high resolution to illustrate twenty prominent structures, most of which no longer exist:
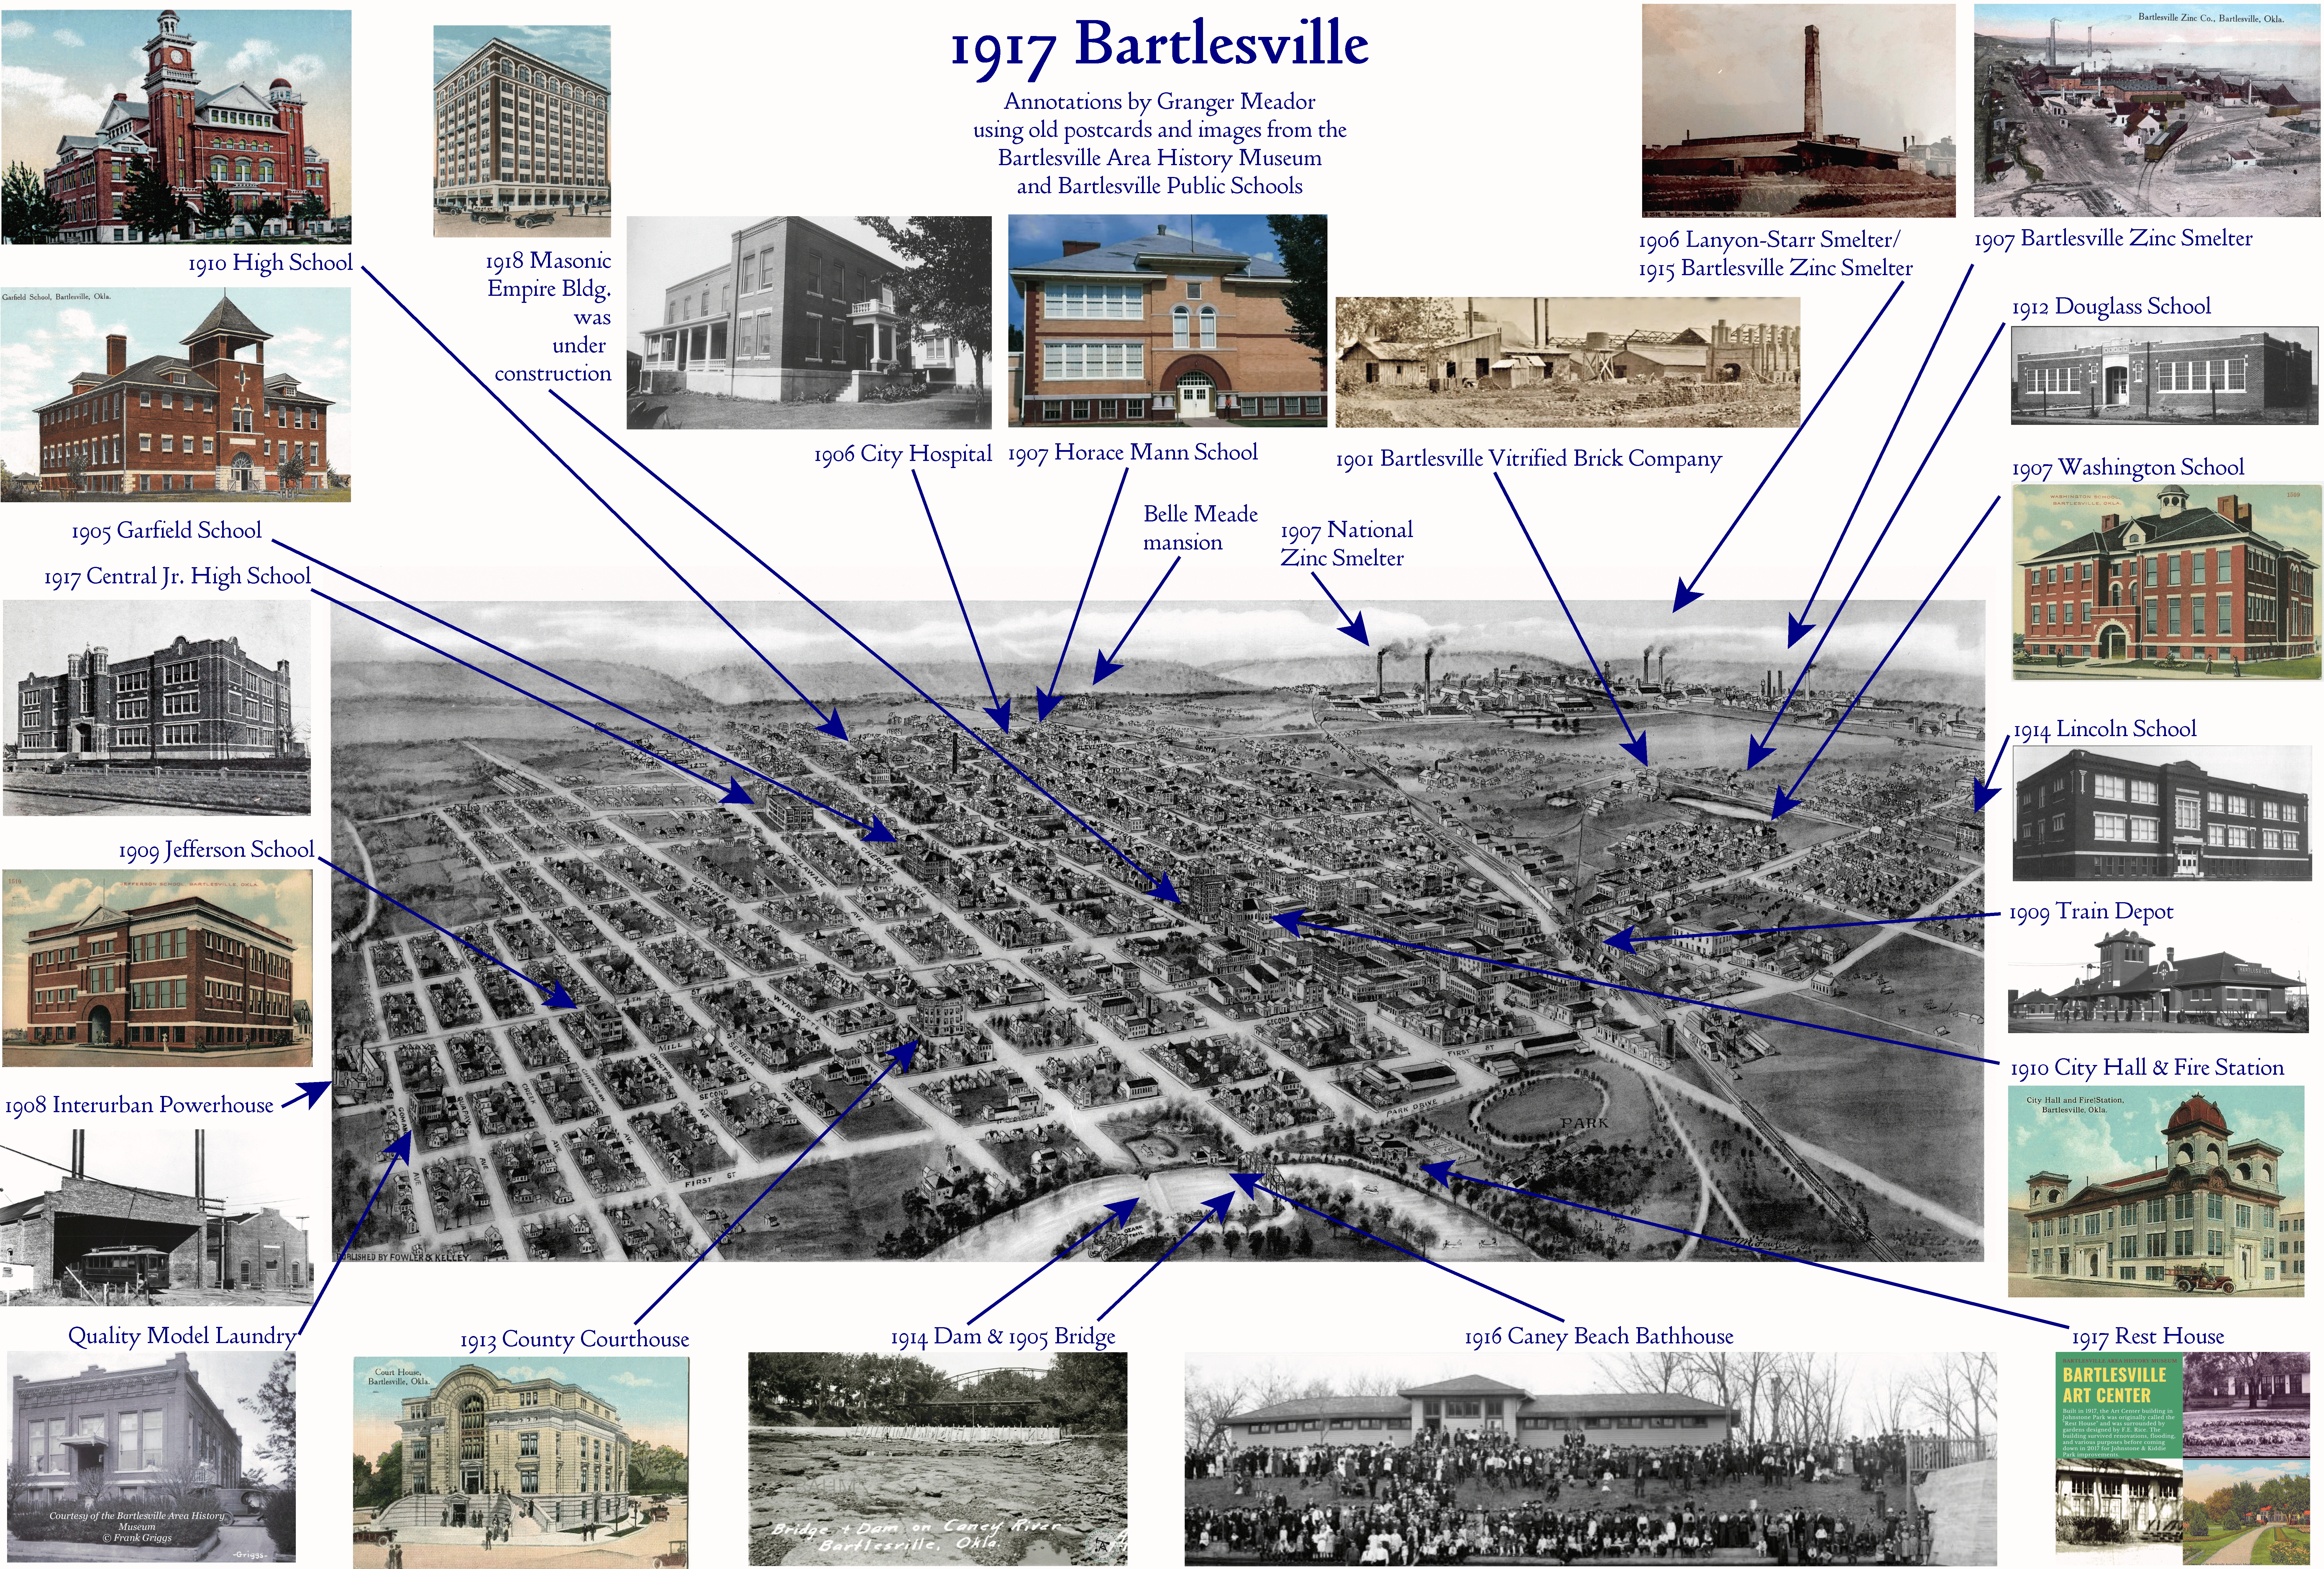
In Fowler’s panorama, Bartlesville is depicted from Comanche Avenue on the east to the Osage county line to the west, and from First Street south to Thirteenth. Below I’ve shown that as a trapezoid overlaid on the city’s current boundaries.

When creating the above map, I wasn’t satisfied with the available views in Google Maps, Google’s My Maps, or Google Earth, nor Bing Maps. I wanted a view that stressed the city limits, while providing a hint of the street grid and topography. An easy way to annotate the map with my trapezoid would be a bonus.
So I used the City of Bartlesville’s Geographic Information System. I loaded the online map using my desktop computer’s web browser and then adjusted the layers to turn off World Imagery and turn on World Topo w/o labels. Then I used the system’s built-in drawing tools to superimpose my trapezoid. A big advantage of doing it within the mapping system, rather than as an overlay on a static image, is that your drawing will scale with the map if you adjust the view.
You can search for similar mapping systems on city and county websites. Bartlesville uses ArcGIS Online, from Esri. You can access many free maps with the ArcGIS Explorer.
Neighborhoods and Subdivisions
Another way to illustrate the city’s early growth is to compare the Sanborn Fire Insurance Maps which are also in the Library of Congress. There were several of them from 1904 to 1920, and I downloaded all of them in high resolution and compiled each set into a PDF:
To see the impact of the boom in the 1910s, we can compare the map of 1909 to that of 1920. The city’s population grew from 6,181 in 1910 to 14,417 in 1920. The 1909 map covers roughly 2.5 square miles, while the 1920 map covers roughly 3.2 square miles.


The maps show that new housing additions that decade that were northwest of the railroad included the Commercial Club, National Zinc Company, Bartlesville Zinc Company, Mound, Keller’s, Cass, Mountain View, Taylor’s Midway, Overlee’s 3rd, Parkview, Industrial, and Park Grove additions.
You might wonder about the Commercial Club and zinc company additions. Three zinc smelters were operating by 1907. The Commercial Club, the predecessor of the Chamber of Commerce, realized housing would be needed and purchased ten acres six blocks north of the initial Lanyon-Starr smelter. The land was divided into 50×125 foot lots and inexpensive frame homes were constructed to sell to smelter workers at $100 each.

The smelter worker communities of Fly Point and Mosquito Row/Skeeter Row were north of the mound in a swampy area, hence their colorful names. My guess is those correspond to the Cass and Mountain View additions.
Additional smelter communities were Smelter Town, Border Town, and Frog Hollow amidst the smelter operations, and Rag Row or Pruneville just south of the smelters. Pruneville got its name from liquor that Polish immigrants made using prunes.
The maps also show how the city grew southward with the Grandview and Belle Meade additions. Belle Meade was originally a mansion constructed by Harold and Zora Lannom around statehood at what is now 14th & Hickory. The mansion, named after the French translation for “beautiful meadow” and which served as inspiration for the later Frank Phillips mansion in town, burned in 1926. It was constructed on 500 acres formed from the Cherokee land allotments of Zora Swafford Lannom and her children.
Finally, the maps show how the city also grew to the northeast with the Armstrong’s 4th, Lucinda Armstrong, Washington Terrace, Capitol Hill, Plumber & Barkers, and Parr & Harnett additions.
We tend to think of cities in terms of neighborhoods, and the local Chamber of Commerce has a map of them in the modern era.

But you can get far more detail by focusing on the actual housing additions. You can map all of their modern-day boundaries in the city’s Geographic Information System by clicking on the layers icon, opening CityMaps and turning on Subdivision outlines.

As an example of the detail you can obtain, Wendy and I live in one of the Arrowhead Acres additions in the southeast part of the city. See the blue square I drew on the above map? Below is what you see if you zoom in on that in the city’s online mapping system.

And you can get even more granular by zooming in even closer and turning on the LandRecords_property outline layer. You can then click on a property to view the more detailed public information about it, including the name of the property owner, its area, when it was last sold, how much it sold for, and the recent land, improvements, and total valuations.
The mapping system is useful in other ways. I’m thinking about adding some fencing along two sides of our lot. Rather than pace it off, a few clicks of the mouse told me that would take about 200 feet of fencing.
Allotments
Wendy and I live in the former Cooweescoowee District of the Cherokee Nation in what was once Indian Territory. So this land went through an allotment process just before statehood. Each member of the tribe received an 80-acre allotment and an equalization payment from the sale of excess land, with individuals selecting 40 acres of their allotments as a homestead. I’ve collected the Dawes Act Cherokee Nation Allotment maps for Bartlesville and the areas north to the Kansas border.
But to use those, you need to know the Township, Range, and Section of the property in question. And for a little lot like ours, which quarter of which quarter-section to focus in on. I like Randy Majors’ Oklahoma Section Township Range map, which lets you locate an area of interest in Google Maps and get the relevant information. For example, to look up our land, I clicked on our house in his map and it told me that we live in the SW quarter of the NW quarter of Section 22, Township 26 North, Range 13 East of the Indian Principal Meridian in Oklahoma.

Then I looked at the Township 26 North Range 13 East allotment map and located Section 22. I’ve outlined the northwest quarter of that section in yellow. It shows allotments to Joseph Sturdivant, Harry Arnold, and three smaller ones.
Then we look for the southwest quarter of that quarter-section, which I’ve outlined in orange. And that is the lower half of the allotment to Joseph Sturdivant. Success!
The Oklahoma Historical Society has an extensive online collection of maps, but it can be a challenge to navigate. Here is how to obtain additional American Indian allotment maps for Oklahoma:
- Go to https://www.okhistory.org/research/maps
- In the left sidebar, scroll down to select Search the Online Catalog
- Select Archives Catalog
- Select the ▶ next to Core Collections at the bottom
- Select American Indian Archives; it will be slow to load the next screen, so be patient
- In the left sidebar, click the + sign next to Maps
- Select the + sign next to tribe of interest, such as Cherokee Nation Maps
- Find a map, such as Map of Cherokee Nation township # north, range # east using the township and range numbers you determine using the locator
- Click the PDF icon at the bottom to load the map in question
Later Plats
Plat maps sometimes just show the lots when a town was initially laid out. I’ve collected those for Washington County, Oklahoma. But those are not nearly as interesting as plat maps which, like the above allotment maps, show who owned the land outside of city limits. Sometimes you can locate such plats from various points in history.
For example, I’ve recently been digitally archiving records that were in deep storage at the administrative building for the school district where I work. One thing I found was a school district boundary map from between 1947 and 1961. It was drawn atop an old plat map which I then annotated with mile street labels.
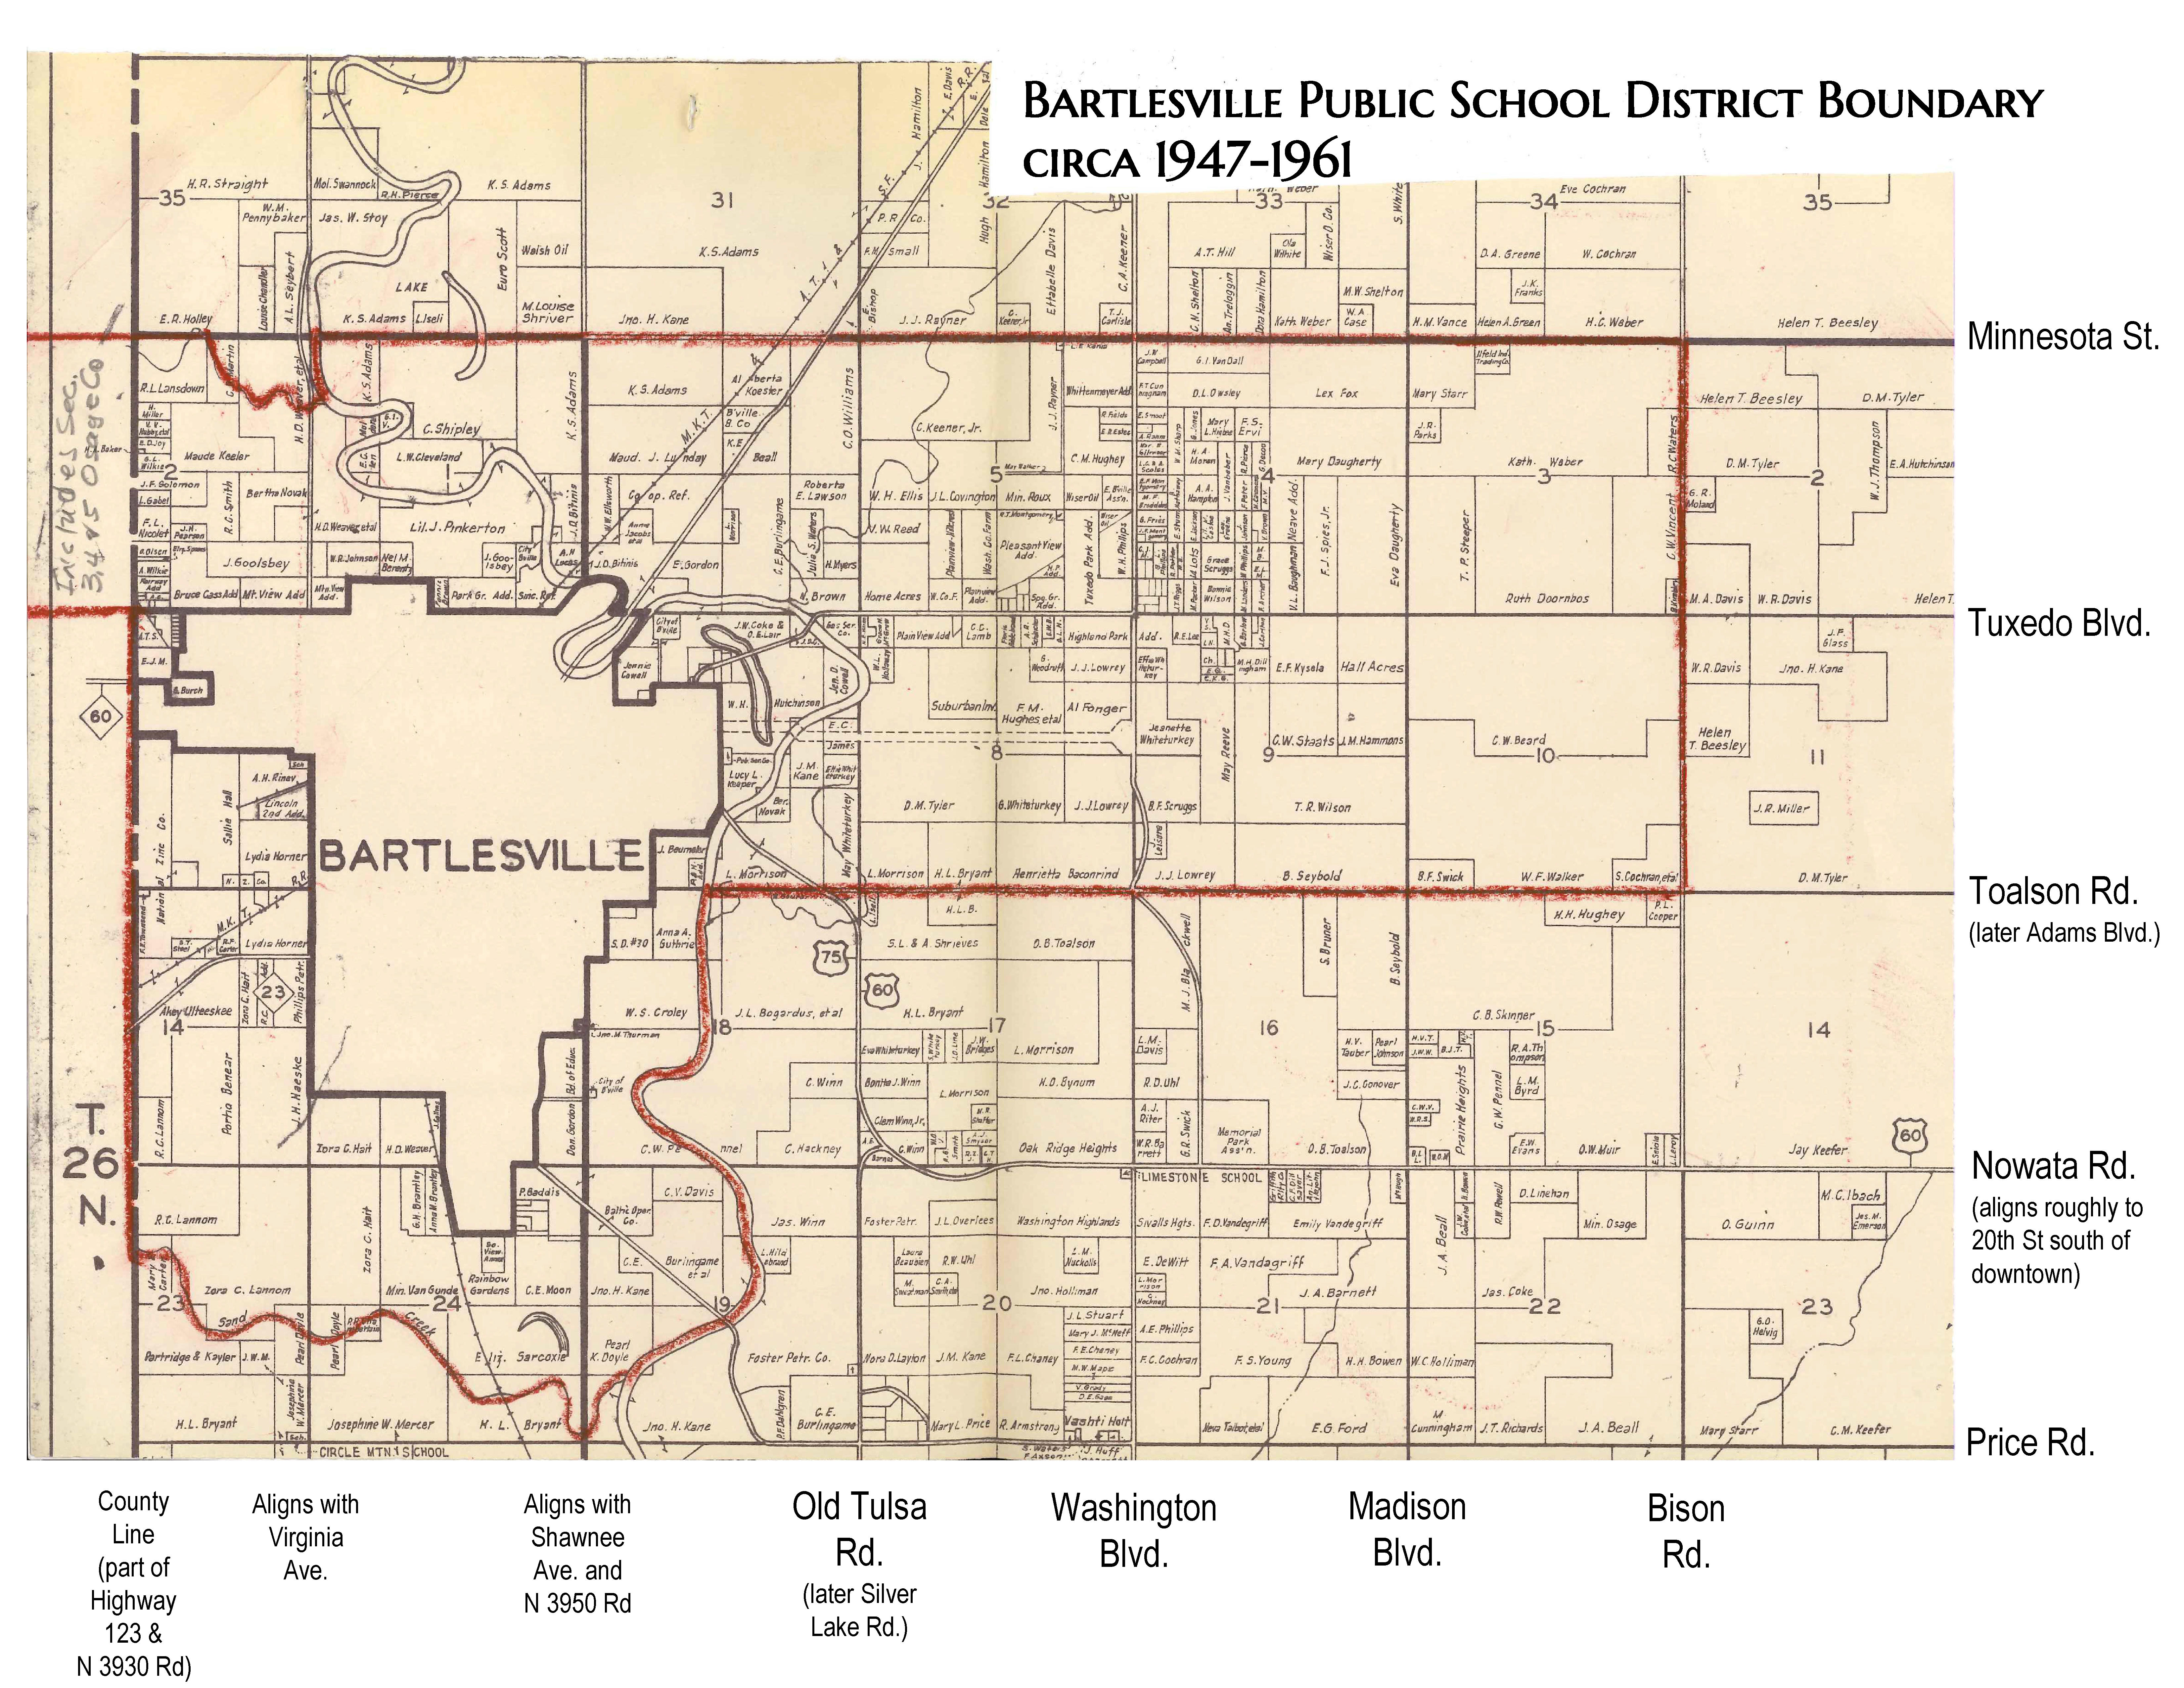
If you study the underlying map, you can see T. 26 N. on the left edge for Township 26 North, and the numbers in each square mile are the section numbers. So if I look in the SW quarter of the NW quarter of Section 22 (in Range 13) I see that the land once allotted to Joseph Sturdivant was later owned by J.A. Beall with some carveouts to the northeast for H. Bowen and J.W. Coke, et al.
How do you find such maps? Well, a Facebook friend asked me to let him know if I ever came across a similar plat map for the area around Copan, a town north of here. I knew that Oklahoma State University maintains an extensive online map collection. So I searched through all of their maps involving Bartlesville and found a 1960 map by Phillips Petroleum that showed pre-1950 plat ownerships for the areas outside the city limits of Bartlesville, Dewey, Copan, and Wann. Bingo! Saving links to good sources and some perseverance can pay off. And by the way, that map showed that a M. Cunningham once owned over half of the mile section where we live, including our little city lot.
Back to Bartlesville’s Growth
Okay, let’s circle back to mapping Bartlesville’s historical growth. The other big growth spurt was in the 1950s. That forced the development of land that was not contiguous, as Bartlesville was bounded by the Caney River flood zone to the north and east and the Eliza and Sand Creek flood zones to the west and south. Another map handily illustrates what I mean:

I got that via the Federal Emergency Management Agency’s National Flood Hazard Layer ArcGIS Viewer.
I marked the narrowing of the Caney River flood zone northeast of Bartlesville’s downtown with Tuxedo, as that is where Tuxedo Boulevard runs eastward to the old unincorporated namesake community. My father was born in Dewey, the town just north of Bartlesville, and lived there until his family moved to Kansas when he was eleven. He could remember how the Caney River would often flood, cutting off the Bartles Road (now Highway 123) from Dewey to Bartlesville.
My father’s family would then roughly follow the route of the old interurban railway which ran between Bartlesville and Dewey from 1908 to 1920. They would head south to the high ground of Tuxedo and then turn west to follow the Tuxedo road into Bartlesville.

there were three schools east of Bartlesville that impacted its development
One obvious solution to building more housing was to jump across the Caney and build housing near the unincorporated area of Tuxedo and the ranch lands south of there. A school for the Tuxedo area called Highland Park had existed since 1909 and its district had been annexed into the Bartlesville schools in 1930.
A Limestone Prairie dependent school district existed south of there. Dependent districts in Oklahoma often only offer elementary and sometimes middle school grades, with older students traveling to independent districts. A one-room Prairie School had operated from 1907-1939 southeast of Highland Park, while a couple miles south of Highland Park was the Limestone School which had grown in 1939 into a three-room school with an auditorium. So one might expect new housing to concentrate around those areas.
That was confirmed by the historical city street maps in the Oklahoma Digital Map Collection at Oklahoma State University. A 1950 Bartlesville street map shows three developments east of the Caney River: Tuxedo, Limestone, and Prairie Heights.

Those areas developed over the 1950s, along with the isolated development of Oak Park northwest of Bartlesville on high ground north of the Butler Creek flood zone. A 1960 street map shows various additions that sprang up.

I have labeled most of the new subdivisions. The developers of the land beyond the floodplain usually emphasized altitude: Pennington Hills, Prairie Heights, Sivalls Heights, Crestview Heights, Oak Ridge Heights, Limestone Heights, Hillcrest Heights, and Washington Highlands. Only one subdivision, just northwest of where I live now, had the temerity to dig down and proclaim itself Beall Valley.
Bartlesville’s growth continued through the 1960s and 1970s, albeit tempered by the nationwide baby bust that began in the mid-1960s. A 1976 street map shows how east Bartlesville continued to fill in.

Woodland Park crossed a brook to add several more additions southwest of its original area. Arrowhead Acres and Colonial Estates began with their initial additions. And there was one major new addition west of the Caney: Circle Mountain Estates up on one of the Osage foothills.
Here is how things had filled out over the next decade as shown on a 1987 street map:

But the 1980s also brought a big oil bust that brought most development to a halt. There were 34,568 people in Bartlesville in 1980, and only 34,256 in 1990.

I purchased my home in the 5th addition of Arrowhead Acres in 1994. It had been built in 1981 as one of the last tract houses Bobby Hindman built in the addition before the bust, as evidenced by the drywall in a closet. It is inscribed, “Another Hindman Home, Drywall by the Hands of Barnhart, Sept 1981” and a handprint.
Wendy and I routinely drive through the 6th and 7th additions of Arrowhead Acres to reach Meador Manor, but those streets were vacant when I bought the house in 1994 and only gradually filled in over the following 20 years with custom-built homes.
Bartlesville only grew by 1.4% in the 1990s, 2.9% in the 2000s, and 4.3% in the 2010s. So let’s see what caught my eye as new additions over almost thirty years between 1987 and 2015:

I watched the two additions closest to me, Southern Hills and Covington Park build out, although they never filled in completely. There are still a dozen lots without houses in Southern Hills and a half-dozen empty lots in Covington Park.
As I write this in 2023, there are a few additions in development: Park Place near Wayside School, Bison Trails northwest of Bison & Nowata Roads, and Stone Branch between Parkhill and Prairie Ridge north of Tuxedo Blvd. So Bartlesville continues to gradually fill in east of the Caney River between Coon Creek on the north and Rice Creek on the south, with only the Covington Park and Southport additions southeast of Rice Creek.
Below is a wider view of the floodzones map, showing that there remains plenty of room to grow to the east if needed.

Can you tell just how much I love maps? I close with a link to all of the maps I’ve mentioned, along with additional maps I’ve collected of Washington County:

But bear in mind this cautionary note from Herman Melville, when Ishmael wrote of his shipmate:
Queequeg was a native of Rokovoko, an island far away to the West and South. It is not down in any map; true places never are.


Great job Granger. That was a fun adventure.