The Meanings We Make Up

Flags are inherently symbolic, with meanings often both subtle and mutable. The associations of colors shift over time and vary among cultures. In the Byzantine Empire, the Blues and Greens chariot racing groups evolved into powerful political and social factions, with the Blues often representing the upper classes and religious orthodoxy while the Greens represented the lower classes and Monophysitism. Their rivalry even led to riots and civil wars.

For the majority of my life, a Red was a Communist, not a Republican. Traditional political mapmakers often used blue for states that voted primarily Republican and red for Democratic strongholds. However, the close Presidential election of 2000 put color-coded maps of which states’ electoral votes were for each candidate before television viewers over an extended period, and the major media outlets began conforming to a scheme coding Democratic states blue and Republicans red, and that has become a fixture of politics for decades.

Which brings me to Oklahoma’s latest license plates, of all things. Last September the state began circulating a new default design. Lt. Governor Matt Pinnell and Service Oklahoma decided to base it on the state’s first flag, adding the current tagline and some tiny silhouettes.

I dislike Oklahoma’s new car license plates
Oklahoma car tag from 1994 to 2008

I’m sure that Pinnell liked the bold and simple design, and maybe, just maybe, as one of the many Republicans who dominate our state government, he also liked the idea of a red plate in this oh-so-very-red state. [Weeks after this post, it was revealed that Governor Stitt was the person responsible for this design. Imagine that.]

The state’s license plates from 1989 to 2008 also borrowed from a state flag, but from the one we have had since 1925, by featuring its Osage war shield crisscrossed with a calumet and an olive branch. I liked those plates, and I didn’t mind when “Native America” was added to them from 1995 to 2008.

Those were replaced from 2009 to 2017 by plates inspired by Allan Houser’s Sacred Rain Arrow sculpture. The U.S. Supreme Court declined to reconsider a court of appeals ruling that threw out a lawsuit against them filed by a Christian pastor from Bethany. He alleged the image symbolized that there were multiple gods and the arrow was an intermediary for prayer. The 10th Circuit Court of Appeals ruled that a “reasonable observer” would not draw such conclusions when viewing the plates.

I agree, and if the pastor were truly offended by the plate, he could always pay for a specialty plate in some other design. In his case, the state’s “In God We Trust” plate would be an obvious possibility, but as of 2025 there would be over 140 other choices, and even more if one can provide certain documentation.

I had my own objections, albeit based on aesthetics and not symbolism, to the next plate that adorned our cars by default, which featured a white scissortail flycatcher silhouette on a background of blue mountain forms. I just didn’t care for it, so I purchased a State Parks Pavilion specialty plate.

I liked that design, and how a portion of the fee is deposited with the Oklahoma Tourism and Recreation Department, which I worked for back in 1985. That brings us to 2024 when the latest default plate began to be distributed, and I do have a symbolic objection to it.

The flag it is based on was adopted four years after statehood in 1911, and it was designed by Ruth D. Clement, who just so happened to be a founder of the state branch of the Daughters of the Confederacy. I doubt it is a coincidence that Ruth designed a red field with a white star offset by blue, which are also elements of the Confederate battle flag.

Oklahoma’s first flag was designed by the founder of the state’s branch of the Daughters of the Confederacy

Mind you, other state flags have or had far more apparent Confederate symbolism. Take our neighbor to the east, Arkansas. It was part of the Confederacy, and the state flag it adopted in 1913 deliberately adapted multiple elements of the Confederate battle flag, shifting from a cross to a diamond shape to represent that at the time it had the only diamond mine in North America. If that wasn’t obvious enough, its legislature deliberately added another star in 1923 to the white field of the diamond that was specifically meant to represent the Confederacy. Mississippi, Georgia, South Carolina, Alabama, and Florida also have or had state flags which were obvious Confederate symbols.
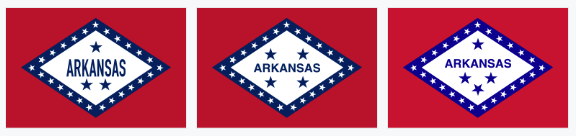
The Arkansas flag has obvious Confederate symbols

As for Oklahoma, its history is grounded in racial cleansing, and some of its displaced First Peoples were themselves slaveowners who dragged their black slaves along on their trails of tears. That putrid state of affairs helps explain why Senate Bill One, the symbolic first bill of the state senate in 1907, was a Jim Crow law that required separate coaches in all public rail cars for “the white and negro races” along with separate waiting rooms in each railroad depot.

Oklahoma’s history of racism is long, ugly, and brutal. In 1917, just five miles north of where I now live, a white mob in Dewey burned the homes of at least 20 black families, and four years later Tulsa had a race massacre 40 miles to the south. I’m pretty confident those occurred in a state flying a flag with subtle Confederate symbolism.

So why did Oklahoma abandon what I presume was its little nod to the Confederacy? Well, there was a Red Scare after World War I, and that was a fear not of rabid right-wingers but of communists and radical leftists. The often-embarrassing Oklahoma legislature passed a silly law in 1919, which lives on today as OS 21 § 374:

Any person in this state, who shall carry or cause to be carried, or publicly display any red flag or other emblem or banner, indicating disloyalty to the Government of the United States or a belief in anarchy or other political doctrines or beliefs, whose objects are either the disruption or destruction of organized government, or the defiance of the laws of the United States or of the State of Oklahoma, shall be deemed guilty of a felony, and upon conviction shall be punished by imprisonment in the Penitentiary of the State of Oklahoma for a term not exceeding ten (10) years, or by a fine not exceeding One Thousand Dollars ($1,000.00) or by both such imprisonment and fine.

Need I state the irony here?

In 1924 the Oklahoma Society Daughters of the American Revolution sponsored a competition to design a new state flag. Louise Funk Fluke of Shawnee designed a blue field with a centered Osage war shield with six painted crosses and seven pendant eagle feathers, overlaid by the peace pipe and olive branch. That’s plenty of symbolism that I don’t find objectionable.

My dilemma is similar to that once faced by the Bethany pastor. I don’t like the new plates which surround me, but a “reasonable observer” would not view them and draw my conclusions. So I don’t care if someone uses the default plate, but I’ll certainly continue to shell out the bucks each year to renew my State Parks Pavilion specialty plate. Maybe I’ll pretend the “46” on the plates doesn’t refer to Oklahoma being the 46th state in the union, but are rather an homage to our 46th President. That would be a hoot.

If you find my take on the symbolism of our plates silly, more power to you. After all, symbols are mutable. An example are the swastikas which adorn the 1920 road bridge in Bartlesville’s Johnstone Park. They were First Peoples symbols for good luck that pre-date the Nazi regime and its different version of the symbol.

One of the swastikas on the 1920 bridge in Johnstone Park

In 1925, Coca Cola used the swastika in advertisements, the Boy Scouts once used the symbol, and the Girls’ Club of America once called their magazine Swastika and sent swastika tokens to young readers.

The swastika symbol for the 45th Infantry Division of the U.S. Army was replaced by a thunderbird in the 1930s

The 45th Infantry Division of the National Guard, most associated with the Oklahoma Army National Guard, originally had a swastika as its symbol as a tribute to the large First Peoples population in the southwestern U.S.

However, the rise of the Nazi party in Germany, which used the swastika symbol pointing clockwise and tilted to stand on one point, led to that symbol and its variants being shunned elsewhere. Coke, the Boy Scouts, and the Girls’ Club dropped it, the 45th Infantry Division switched to a thunderbird, and Bartlesville now has signage explaining its bridge symbols. They didn’t have to do those things, since their swastikas didn’t fully echo the design of the Nazis, but like me with the original Oklahoma flag, it made them, shall we say, uncomfortable.
Posted in history, politics | 1 Comment

¡Arriba, Arriba! ¡Ándale, Ándale!

Digital technology makes it easy to modify the rate of media playback, and pitch correction makes it far more practical. My wife routinely plays YouTube videos at high speeds, and some folks speed up their audiobooks and podcasts. Recently, Audible said 7% of its listeners had tried listening to audiobooks at higher speeds, with 1.2x and 1.5x being the most common choices, while those who listen to content at more than 2x are often listening to newspaper or magazine articles.

I prefer to listen to audio and watch videos at normal speed, but I have sped up a book or two that was read by a slow narrator. When I overhear one of Wendy’s videos playing back at high speed, instead of being reminded of Alvin & the Chipmunks, pitch correction instead leads me to think of Speedy Gonzales: “¡Arriba, arriba! ¡Ándale, ándale!”

Of course, analog technology also allowed for faster or slower playback, although it seldom compensated for the resulting change in pitch. Back in November 2023, when I reviewed my personal history with recorded music, I noted how the ready ability to change the rotational speeds on phonographs led to discoveries such as transforming Anita Ward into what I imagined to be a male singer by playing her song Ring My Bell on a 45 rpm single at the reduced speed of 33-1/3.

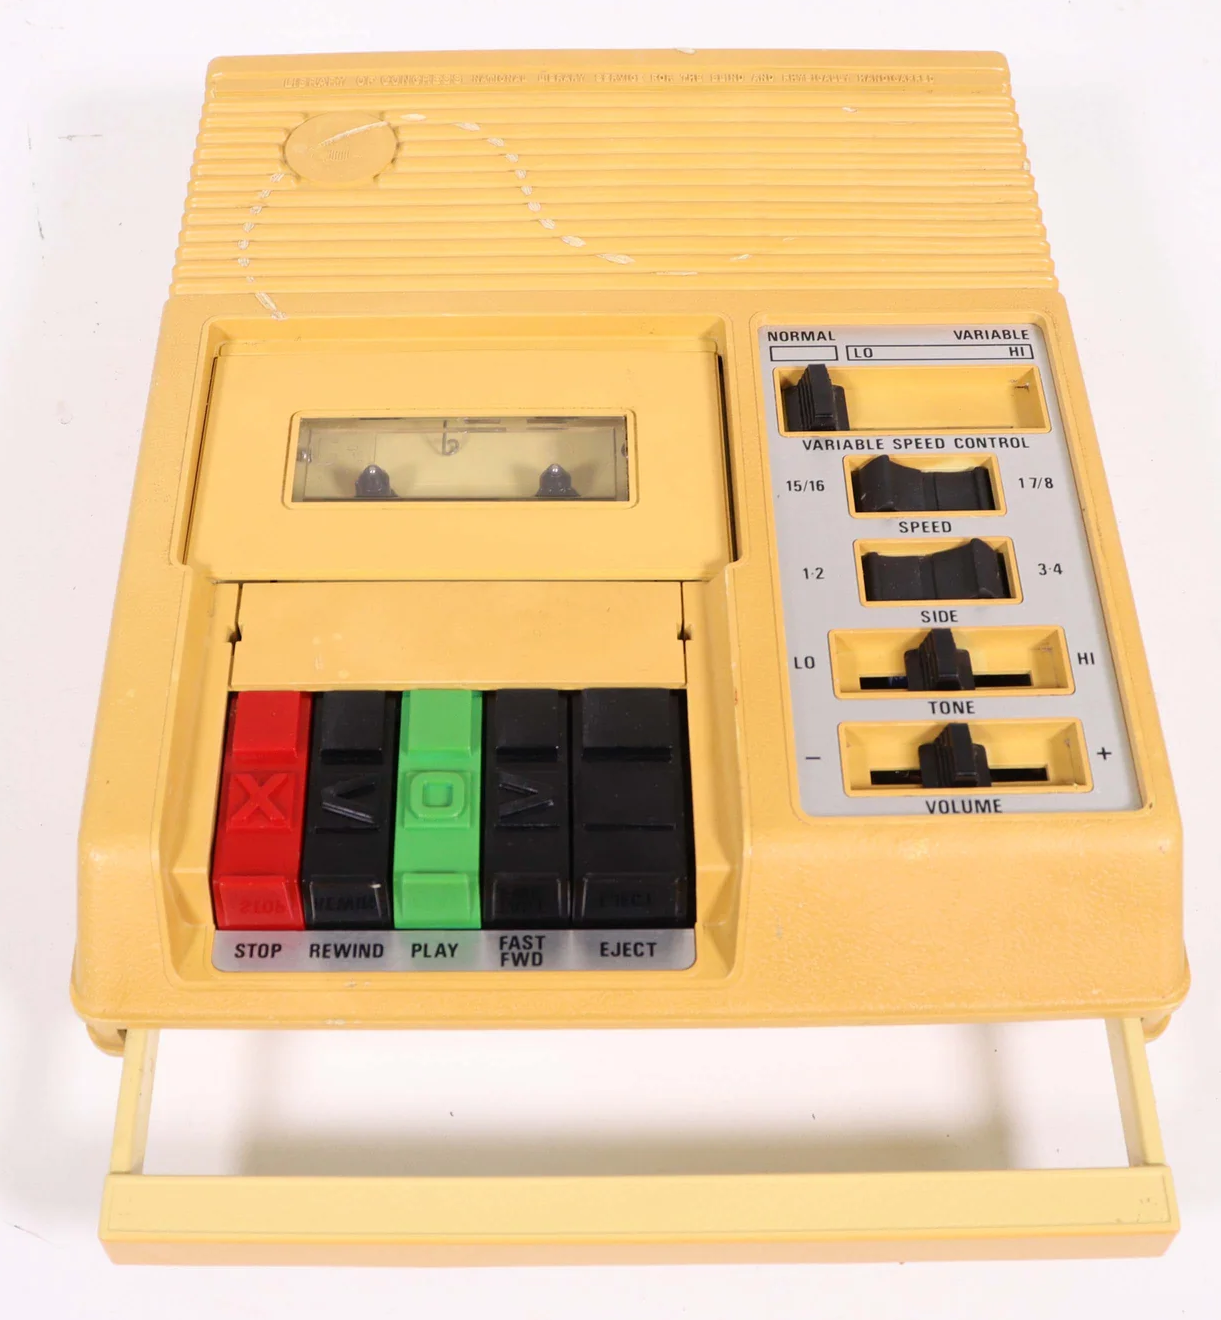
When I was in junior high school, one of the neighborhood kids had poor eyesight, and he had a special cassette tape player with adjustable playback speed for audiobooks. It was a Library of Congress C1 unit, which could lengthen the playback time of a standard C90 cassette, normally limited to 45 minutes of stereo audio on each side, to up to 6 hours using specially recorded 4-track monophonic tapes.

The units had no digital pitch correction, so we amused ourselves by playing with its vari-speed control.

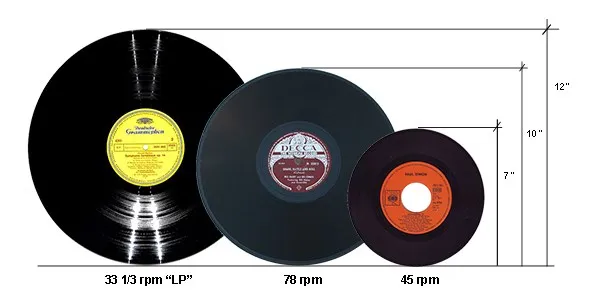
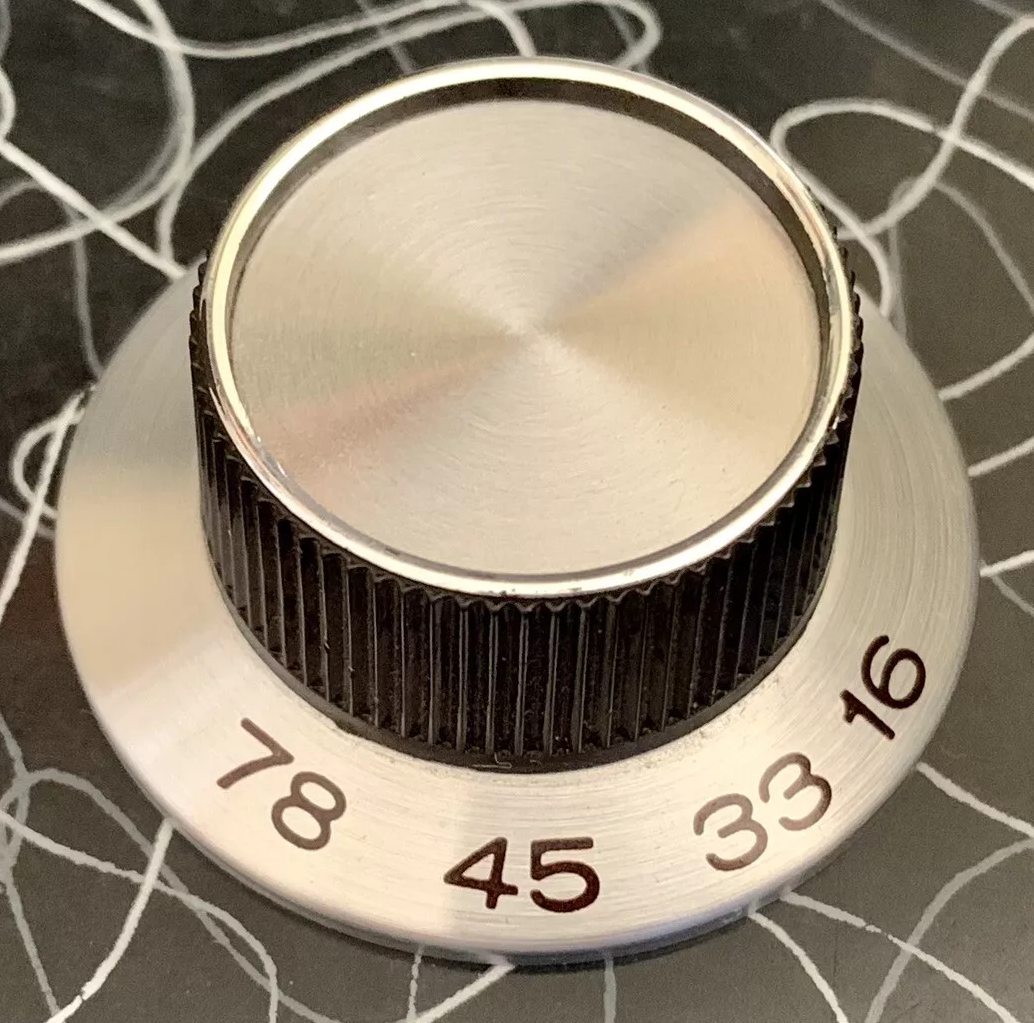
Analog speed changes over at my house were accomplished via my mother’s 1950s four-speed Silvertone suitcase-style phonograph player, which could play records at 16-2/3, 33-1/3, 45, and 78 revolutions per minute.

Phonograph discs played at 78 rpm were produced from the late 1890s to the late 1950s, but the only ones we had were in an actual album of records by Nat King Cole that my father had picked up at a garage sale. I took it to Bartlesville High School decades later when showing phonograph technology to my physics students as an application of circular motion. Some still knew that an “album” was a 33-1/3 rpm 12-inch long-playing record, usually with 10-12 songs, but they didn’t realize its name came from the actual albums you needed to get that many songs on 78s. Such lingering anachronisms are fairly common…do you still hear people say they will “dial” a telephone number? I’ll wager they won’t!

An actual album of 78-rpm records

Columbia introduced the 33-1/3 long playing record in 1948. It was not only larger and rotated more slowly, but it also downsized the grooves to be used with a stylus with a 0.001″ radius of curvature, whereas the styli for 78 rpm records had a 0.003″ curvature. RCA promptly initiated a format war, introducing its own smaller 45 rpm records, and when I was a kid you bought your singles on 45 rpm 7″ records and “albums” on 33-1/3 rpm 12″ records.

But what about the 16-2/3 playback speed on my mother’s old record player? I only used it to have fun slowing down albums by half and singles by almost 3/4. The format was never highly standardized, but some excellent articles by Mike Dicecco detail its use for some audiobooks and background music systems, as well as in a short-lived system for Chrysler automobiles in the late 1950s.

The three most common types of phonograph records

There are many examples of using variable tape speeds to create art. Beatle John Lennon famously wanted the song Strawberry Fields Forever to be released using two different takes which had different tempos and keys. Geoff Emerick and George Martin used the vari-speed control on the tape machines to speed up one take and slow down the other to better align the pitches.

Some UK disc jockeys failed to read the label and played this back at 45 rpm

However, I’m more amused by mistakes. Herb Alpert’s song Rise became a club hit in England, but at the wrong speed. The length of the song meant it wouldn’t fit on a 7-inch 45 rpm record without editing, so a 12-inch single was released. However, that single was cut for playback at 33-1/3 rpm, while at the time most 12-inch singles were played at 45 rpm. Some disc jockeys in Britain accidentally played it at the wrong speed, and that helped it become a disco hit over there.

Funly enough, Rise was originally written at a disco-friendly tempo of about 124 beats per minute, but Herb decided he preferred a slow take with a tempo of 100 beats per minute, which allowed club audiences to “dance and hug each other at the end of the night.” While that approach worked to propel the song to #1 in America, in some British clubs it was often accidentally being played at 135 beats per minute.

I listened to Rise at that rate, but I preferred the original. I couldn’t find a properly sped-up version online, so I ripped the 12″ single version of Rise into an MP3 file and used the Audacity software to speed it up. That’s easy to do, since Audacity’s Change Pitch and Speed effect dialog already has presets for changing playback from what would be 33-1/3, 45, or 78 on a phonograph to another of those speeds. I’m surprised that they didn’t include 16-2/3, but perhaps none of the Audacity programmers ever used a four-speed phonograph.

Other songs people have recommended for playback at altered speeds include I Got You Babe by Sonny & Cher, Relax by Frankie Goes to Hollywood, and Video Killed the Radio Star by The Buggles, but like Jolene and Ring My Bell, those are all slow-downs. ¡Abajo, abajo! ¡No, no!

Dan O’Herlihy in Fail Safe

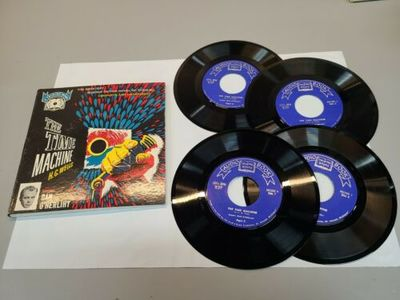
Speaking of slow, I was intrigued to see that actor Dan O’Herlihy did a spoken-word version of H.G. Wells’ The Time Machine on 16-2/3 records. I remembered O’Herlihy’s resonant voice from the splendid 1964 movie Fail Safe. I can’t provide a sample of his take on Wells, but the Internet Archive has selections of Walt Whitman’s Leaves of Grass read by O’Herlihy.

Norman Field with a 20″ record of 1913

Years ago I watched Norman Field demonstrate a 20″ French Pathé ‘Theatre Disc’ from 1913 which was meant to be played at 60 rpm. I was surprised to learn that their “usual” 20-inch records played at an incredible 120 rpm. The high speed really vibrated the stylus, allowing for high-volume playback before electrical amplification.

At the other extreme, the internet informed me that there were some 8-1/3 rpm records produced by the American Foundation for the Blind, with 12″ versions that could play for up to six hours. I found a video of a 7″ 8 rpm disc being played, but the children’s story it presented was so boring that if I were a kid, I’d want to play it at 78, crying, “¡Arriba! ¡Ándale!”

Posted in music, technology | Leave a comment

Steady as she goes

When there is an economic recession, we hear about major losses in stock valuations, job losses, and the impact on retirement savings. Economists worry that Trump’s trade wars could trigger another one, with a market correction and a bear market in the Nasdaq developing in the early spring of 2025. In the past two days, my 403(b), an educator’s version of a 401(k), lost 8% of its value, and I will be retiring in less than 15 months.

However, I’m not panicking. I’ve lived through eight recessions, with half of those coming over the past 35 years of my working life, and my approach for over 30 years has been to employ dollar cost averaging and stay the course, investing a fixed amount of money at regular intervals, regardless of the current market conditions. That reduces the impact of market volatility over time.

I was too young to remember the Nixon recession of 1970, and I have only scattered impressions from the 1973 oil crisis that triggered a recession. However, I was in high school during the twin energy crisis recessions of 1980 and 1981-1982, and those certainly impacted my family, since my father was a petroleum engineer.

The periods of growth in our country’s gross domestic product, interrupted by recessions [Source]

Dad was the manager of Gas Measurement for Cities Service, and he survived a takeover attempt by Mesa, a failed merger with Gulf, a merger with Occidental, and then Cities Service Gas being sold off to Northwest Energy and then Williams to pay down the debt from the Occidental merger. He was finally forced out in the Williams acquisition, ending his 35-year career in the petroleum industry at age 58.

My mother continued working at a savings and loan, but those institutions experienced a first wave of failures in that recession. Hers survived until 1991, but it then succumbed, ending her working life at age 54. That was right after the end of the Gulf War recession, the first recession during my own working life.

When I began teaching in 1989, my parents ensured that I had an individual retirement account that was added to annually, as they knew how important that would be for me decades later. I’ve always deposited the most I could in my IRA each year throughout my career, but the volatility of the market is better illustrated by my 403(b), in which I have invested about 10% of my gross salary each month since 1992.

I thought it might be instructive to see how it fared through three different recessions, but bear in mind that I am anything but a financial expert. I’m just sharing a fractional view of my own experience, and you should consult a professional financial advisor about your own investments, such as a Certified Financial Planner or Chartered Financial Analyst.

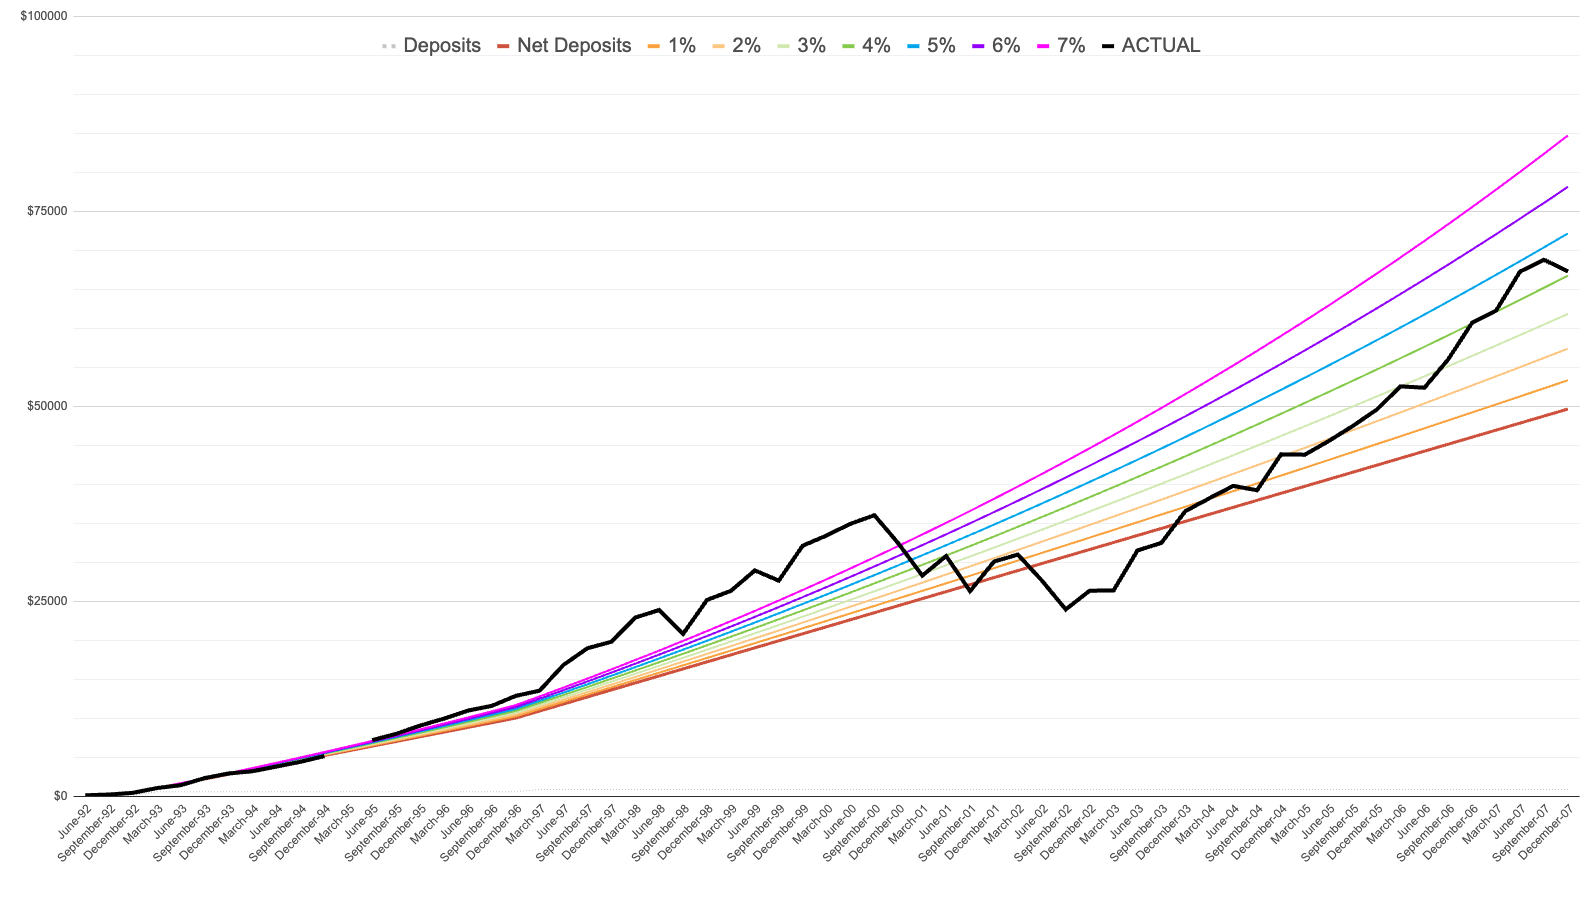
A majority of my 403(b) was invested in the stock market, and by the end of the long expansion of the 1990s I had invested about $24,000 while the account’s value had reached about $36,000. That computed to be a fantastic rate of return, but of course it couldn’t last.

The first 15 years of my 403(b); the recession of 2000-2002 was painful

When the Dot Com recession in 2001 struck, I trusted in the power of dollar cost averaging. So I made no adjustments in my investment mix nor the amount of my paycheck that was diverted each month into my ever-dwindling 403(b). By late 2002, I had invested about $31,000 in it, but its value was only $24,000! The recession had wiped out a decade of gains and then some, putting my account well underwater.

However, I knew that my monthly investment was then buying more shares at their reduced prices, and whenever the market finally recovered, my gains would reappear. I wasn’t back above water until the end of 2003, three years after my 403(b) began to tumble, and it never again reached the immense percentage gains of the 1990s. By the end of 2007, I had invested a total of $50,000 over the previous 15 years and the account was valued at $67,000. I calculated my overall rate of return somewhere between 4% and 5%. Nothing to brag about, but I had no financial advisor at the time, and my strategy was building what will eventually become one of my primary income sources in retirement.

Then the Great Recession hit, the longest economic downturn since World War II. My 403(b) again steadily declined, again going underwater.

My 403(b) during the Great Recession of 2008 and its slow recovery

By March 2009, I had invested over $54,000 in it since 1992 but the account was valued at less than $40,000. Again, I stayed the course, continuing to invest. The economy and the market recovered, and my account finally recovered to an overall return above 4% in late 2013, six years after the Great Recession began, and again beating overall inflation.

We then had some downturns and corrections, but there wasn’t another recession until COVID-19 triggered one in early 2020. By then I had invested over $112,000 and my account was valued at over $240,000, and I calculated my overall rate of return at around 6%.

I didn’t just keep dollar cost averaging, as I also needed to periodically assess the mix of assets, primarily how much was invested in higher-risk equities and how much in lower-risk fixed-income assets. On rare occasions, when the market was healthy, I have reallocated funds when my exposure to equities was too high for my comfort. However, I never made such adjustments when the market was down, as I wanted to lock in gains, not losses.

To keep my own amateur adjustments to a minimum, for some years I have kept most of the account in a Lifecycle Index 2035 fund, which gradually becomes more conservative in its investment mix over time. It currently has about 2/3 of its assets in equities and 1/3 in fixed-income assets. That will reach an even split in 2035 and by 2065 will be 20% equity and 80% fixed-income, although it seems unlikely I’ll still be around to witness that.

Most of my 403(b) is in a fund that gradually becomes more conservative over time to reduce risk in my old age

The COVID-19 recession didn’t impact my account nearly as much as the earlier Dot Com and Great recessions. My overall rate of return at first dipped to less than 5%, recovered over the next two years to reach almost 7%, but then dipped again in 2022.

Since then it gradually rebuilt to above 6%, and this week it dove to about 5.5%. I realize it could dip much lower before I retire in June 2026, when my deposits will stop. However, I don’t expect that impact on one of the legs of my retirement stool to delay my retirement nor reduce my withdrawal plans. My parents left the workforce at ages 54 and 58, right after recessions, yet they enjoyed long and comfortable retirements. It certainly helps that in addition to individual retirement accounts and 401(k)/403(b) plans, both my father and I were able to pay into defined-benefit pension plans that were shielded from market volatility, although their fixed payouts don’t offer protection from inflation.

I will keep my money invested, trusting that no matter how low the markets get, they will eventually rebound and my retirement assets will be rebuilt. My own experience is that could take a half decade or more after a big recession, but hopefully I have plenty of time. My father lived to age 97, my mother is enjoying independent living in Bartlesville at age 88, and I have a 50% chance of lasting another 30 years..and I fully intend to be retired for almost all of them.

Posted in random | Leave a comment

The Lonely Washing Machine Repairman

Throughout my childhood, from 1967 to 1988, actor Jesse White portrayed “Ol’ Lonely”, the Maytag repairman who never had enough to do. Eventually other actors, including Gordon Jump of WKRP in Cincinnati fame, played the role. The campaign rang true with our family, since our Maytag washers and dryers lasted for decades.

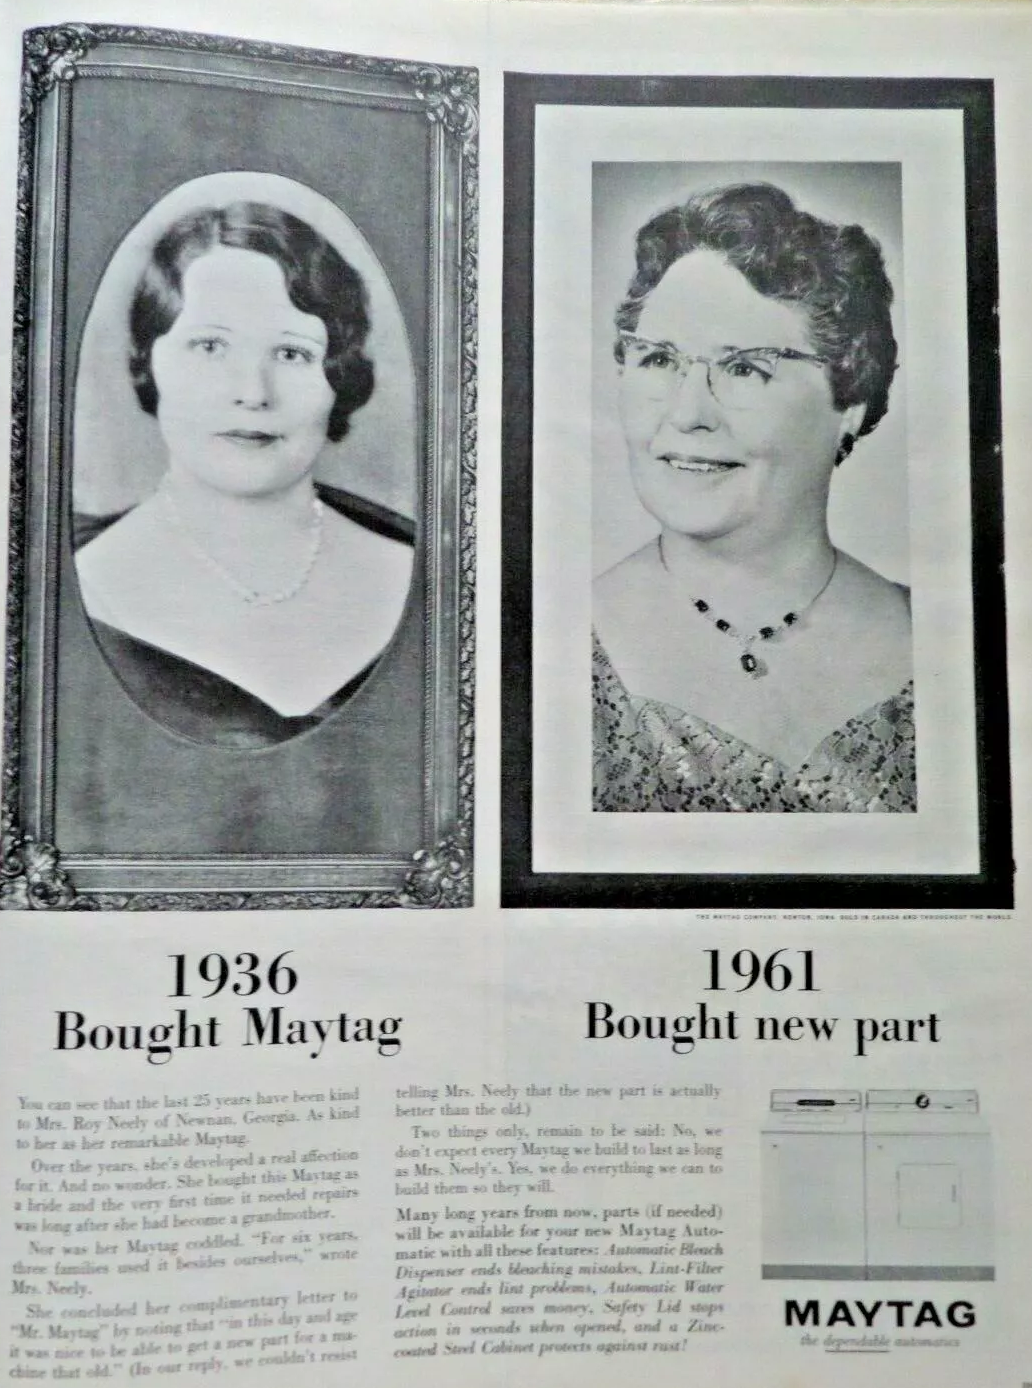
1962 Maytag ad about a Georgia woman whose Maytag finally needed a new part after a quarter century of heavy use

Before the iconic television ads, Maytag advertised its reliability in print with ads such as one about a Georgia woman whose 1936 Maytag washer was used by four families and finally needed a part replaced after 25 years.

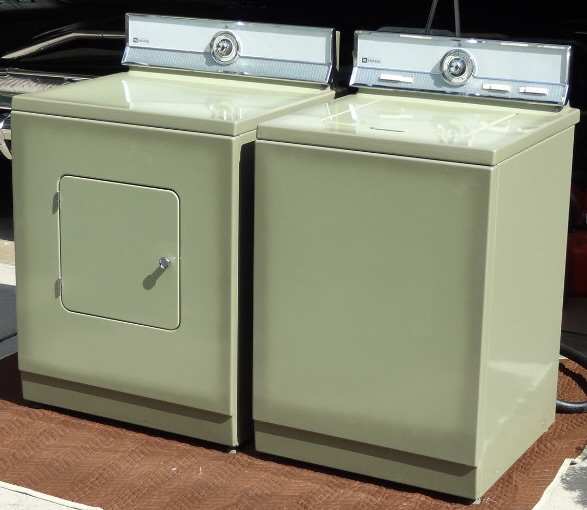
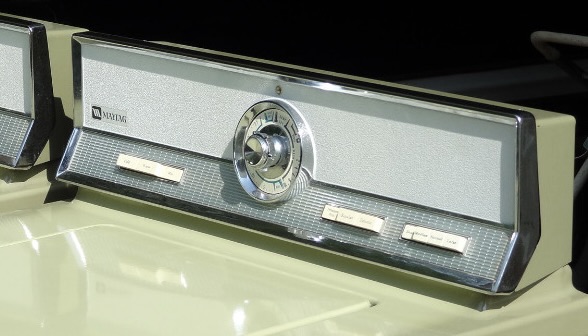
In the early 1970s, my parents bought a Maytag washer, in the trendy avocado green of the day. In 1978, they purchased a matching Maytag dryer.

As a kid, when unsupervised I liked to dial up the spin cycle on the washer, prop open the lid, and jam its switch so it would keep running. I would toss in a washcloth and marvel at how it seemed to disappear due to the high spin rate and the limitations of my vision.

In 1989, when I moved into my own apartment in Bartlesville, I had a small washer and 120-volt electric dryer, of a brand I don’t recall. They were barely adequate, with the dryer taking an extraordinary amount of time to dry towels due to its low voltage. The next year I moved into a rent house and was delighted when my parents gave me their Maytag washer and gas dryer, even if the washer was about 18 years old and the dryer age 11. Those were far superior to what I had been using.

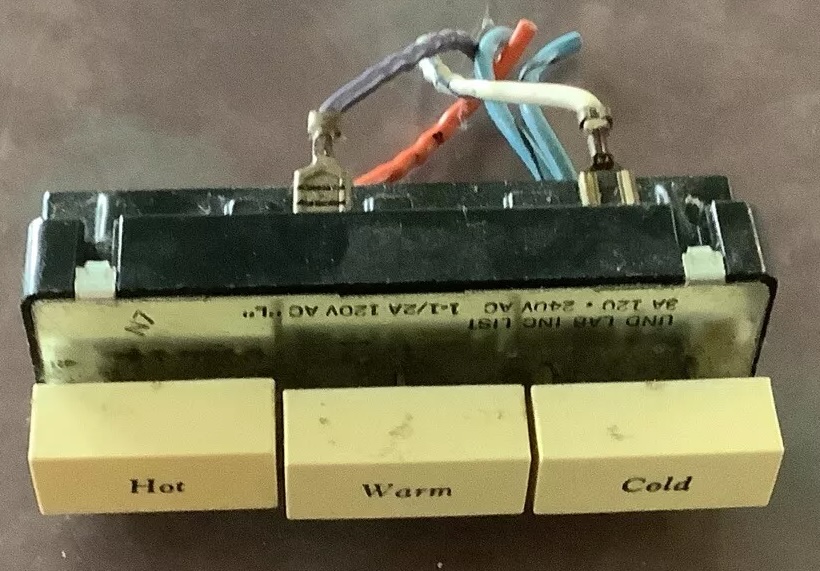
The washer finally did need a repair, as the water temperature selector switch stopped engaging. I unscrewed the top panel and was able to easily disconnect and remove the faulty switch, buy a new one from a local supplier, and be back in business. I could see my repair for years, since the new switch buttons were bright white, while the old buttons for cycle type and load size had yellowed with age.

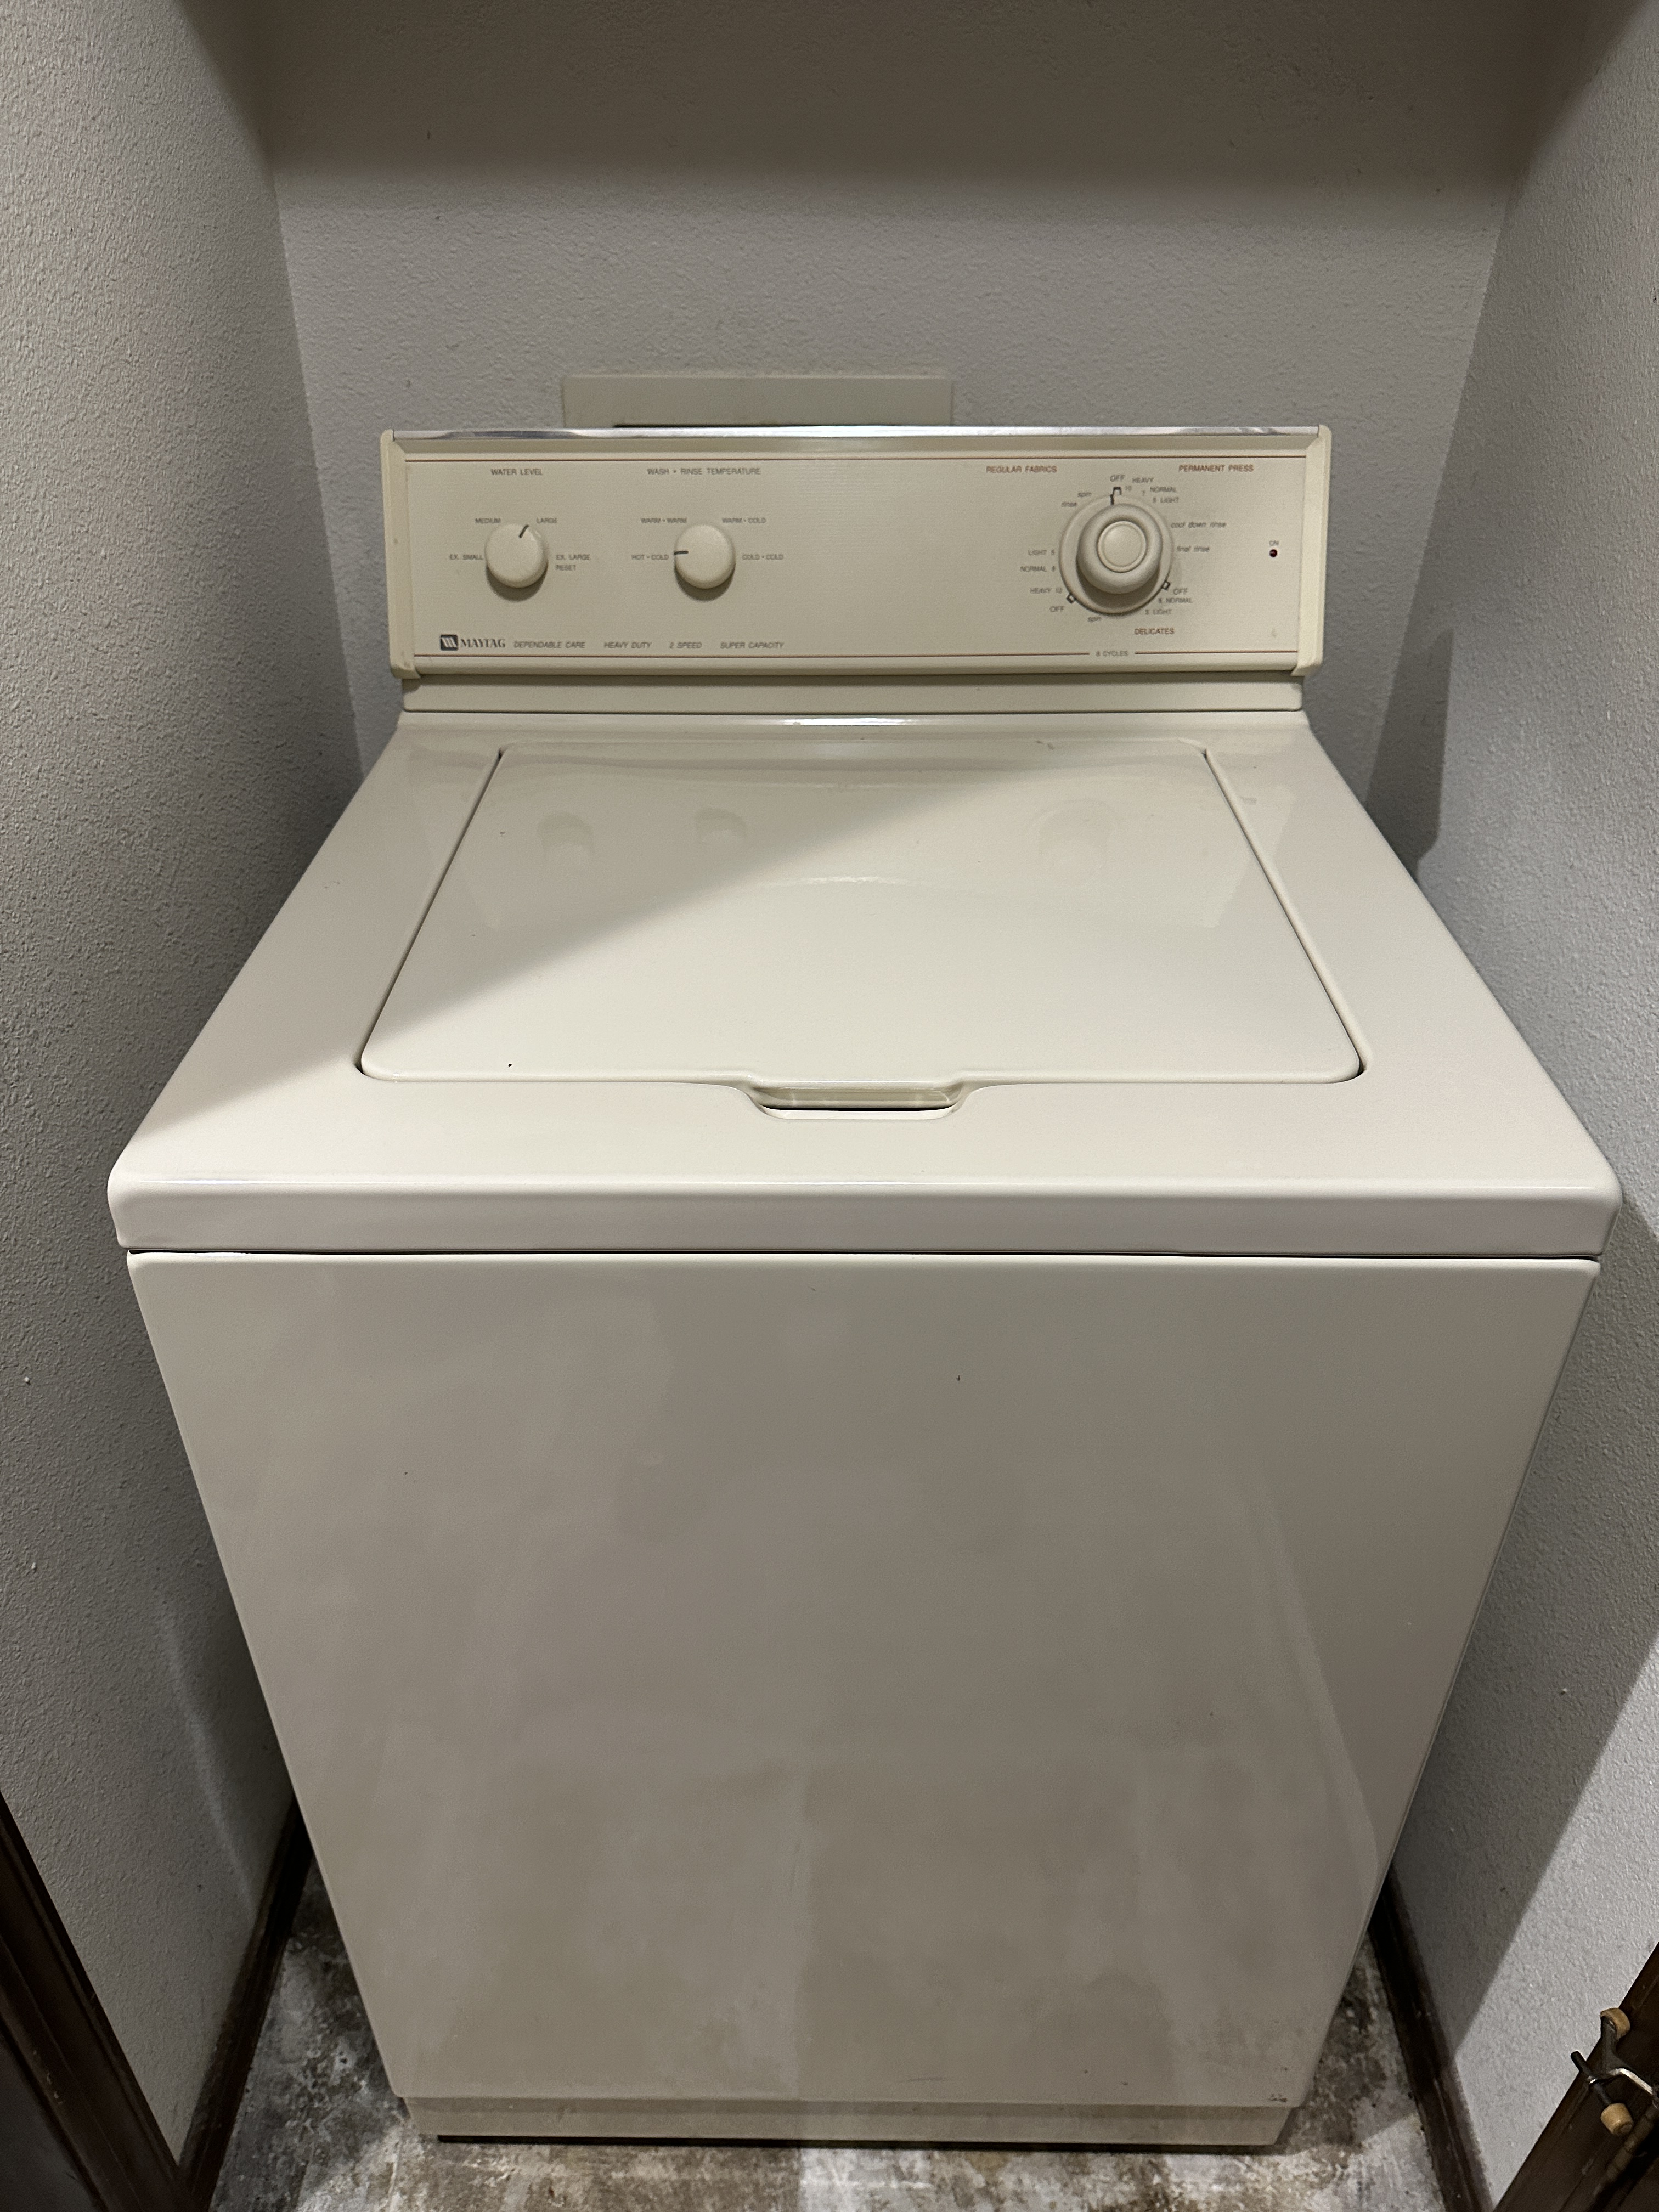
My 1996 Maytag only needed one repair over its 29 years of use

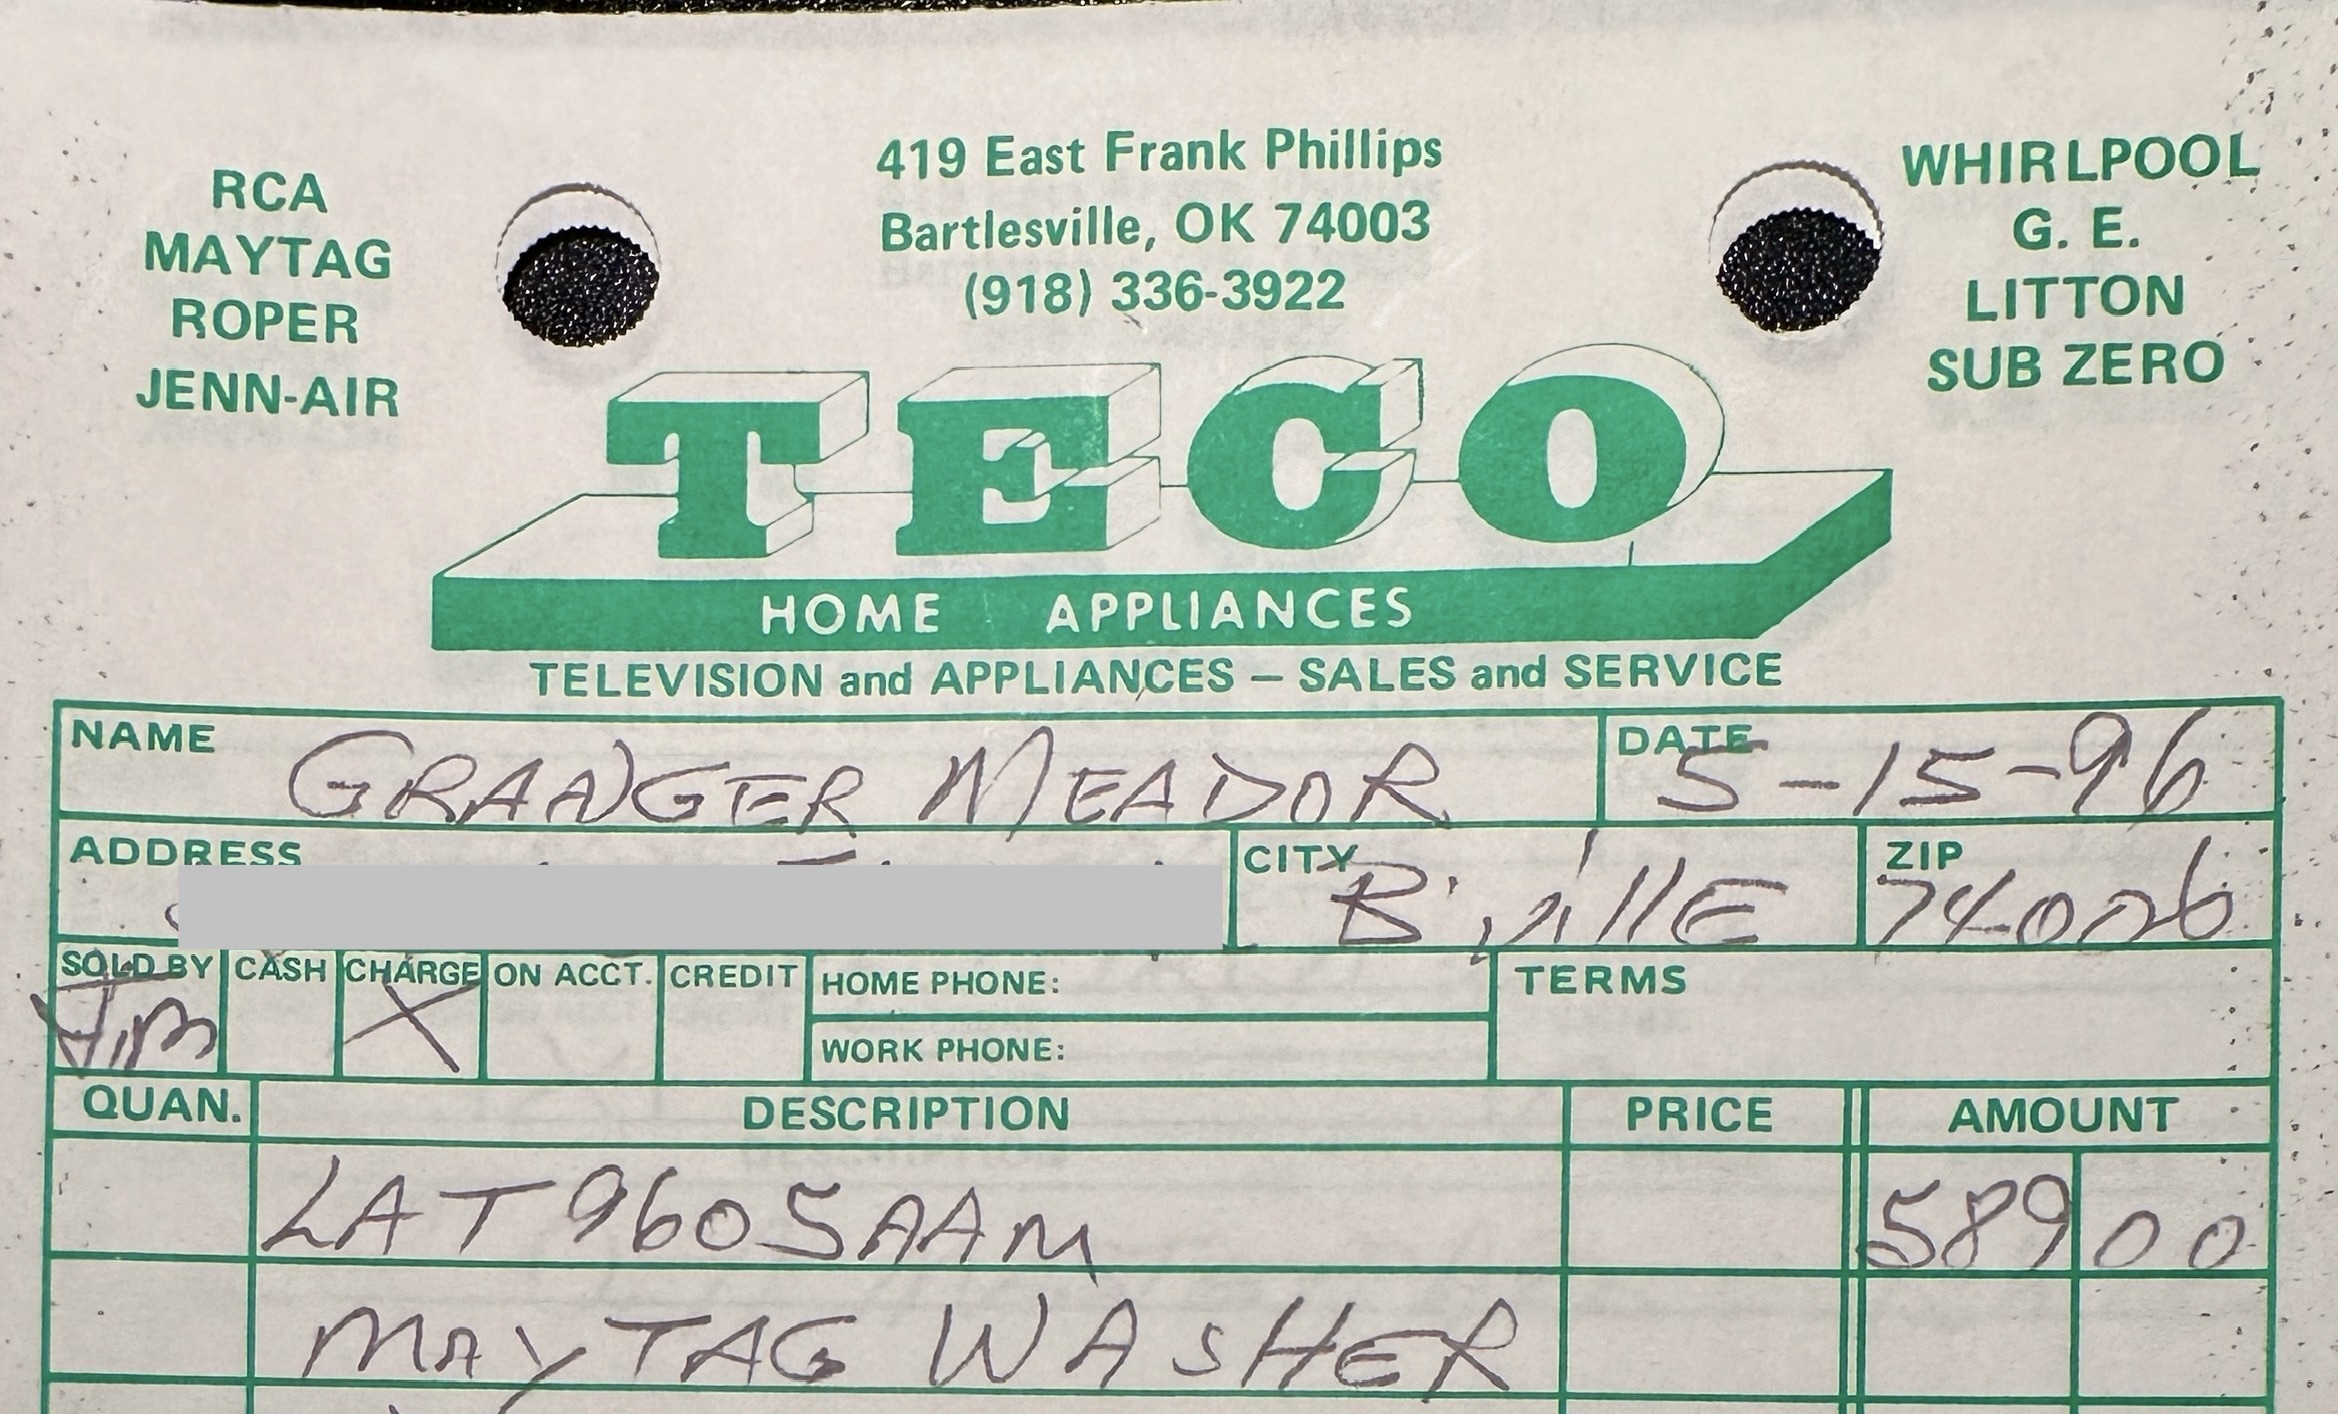
In 1996, the washer broke again, and this time it would have required a more significant repair that would have strained my finances as an underpaid schoolteacher in Oklahoma. However, I had just received the local Kurt Schmoldt Teacher Appreciation award, a cash prize that would cover virtually all of the cost of a new washer. So rather than try to have a 25-year-old unit repaired, I went to the local TECO appliance store, which Ted Schwermer founded in 1969; his son Gary ran the shop from 1985 to 2016.

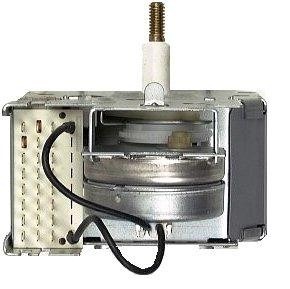
A timer I found on eBay brought my washing machine back to life

I told them that I wanted another Maytag, and they fixed me up with one for $589 that ended up lasting 29 years. I did have one repair on that washer over the decades. In 2008, after perhaps 2,500 loads, the washer began running the motor at the wrong speed and sometimes stopped in the middle of a cycle. I had a repairman out, who said it was a bad timer and since the model was no longer manufactured, he could not replace it.

Rather than buy a new washer, I paid the repairman for his diagnosis and his time, and then I went on eBay to buy a new electromechanical timer for $88. I installed it and was back in business for almost 3,500 more loads of laundry. My total capital and repair costs ran to less than 13 cents per load over three decades.

However, a few weeks ago I was doing the laundry and my socks got wet…the ones I was wearing, that is. The washer had leaked water across the tiny utility room and a bit into the adjacent kitchen. I dried things out and checked the hoses and drain, but I couldn’t locate where the water leaked from. Later loads that day were fine, so I hoped it was just a fluke…but I knew better.

Sure enough, a couple of weeks later another load leaked a bit, and since the leak was something intermittently amiss inside a washer approaching 30 years of age, rather than crack it open to try to diagnose and repair it, I decided it was time for a replacement. It struck me as better to enter my retirement in July 2026 with one-year-old washer rather than one with 30-year-old parts. But this time, despite the great reliability of the Maytags of the 20th century, I knew that I wouldn’t be buying that brand.

A Very Brief Maytag History

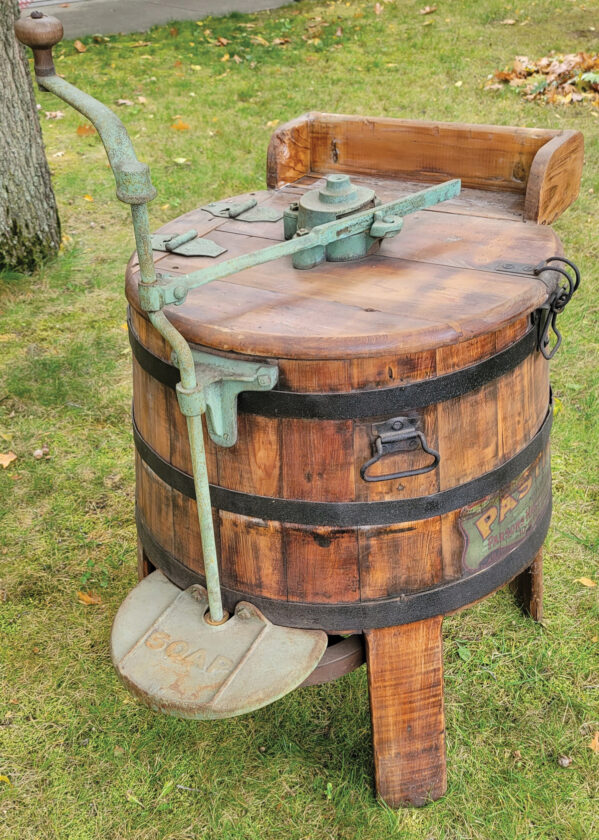
One of Maytag’s first washing machines [Source]

Frederick Maytag, his two brothers-in-law, and George W. Parsons started a new farm implement company in Newton, Iowa in 1893, producing threshing machines, band cutters, and self-feeder attachments. It became the Maytag Company in 1909 after it began manufacturing washing machines to fill in the seasonal gaps in the farm equipment business.

The first Maytag washer, the “Pastime,” was a wooden tub model with a hand crank that had a retail price of $11 to $15, the equivalent of about $450 in 2025. 

By 1927, the Maytag Company was producing more than twice as many washers as any other competitor. They didn’t start producing clothes dryers until 1953, and the Maytag family sold their appliance business in 1962. Its reputation for durability and dependability would endure until the 21st century.

Maytag was acquired by the Chicago Pacific Corporation, the remains of the Chicago, Rock Island & Pacific Railroad, in 1988, which also owned the US and UK divisions of Hoover. In 2004, it was still producing 88% of its products in older US-based factories, but the company hurt its reputation by selling low-end Amana models produced in Searcy, Arkansas as Maytag-branded ‘Legacy Series’ machines.

Front-load washing machines that used less water and energy were promoted by the government in the early 2000s, but Maytag’s Neptune line of front-load washers were called Stinkomatics by dissatisfied customers when the washers developed mold that was not easily cleaned. By 2005, the company’s market share had declined to all-time lows, sales were flat, and it was ranked low in customer satisfaction. Whirlpool completed its acquisition of Maytag in 2006.

Switching Brands

When I purchased my new Maytag washer in 1996, I kept using the 1978 avocado green gas dryer. Its burner finally failed in 2003. Consumer Reports had warned me that Maytag was no longer a reliable brand, so I purchased a KitchenAid gas dryer that worked fine until 2020. While the Maytag dryer had lasted 25 years with one igniter replacement during its run, the KitchenAid only lasted 17. By then, Wendy and I were married, and she isn’t a fan of natural gas dryers. Our 1981 home was built to support either type of dryer, so we switched to electric.

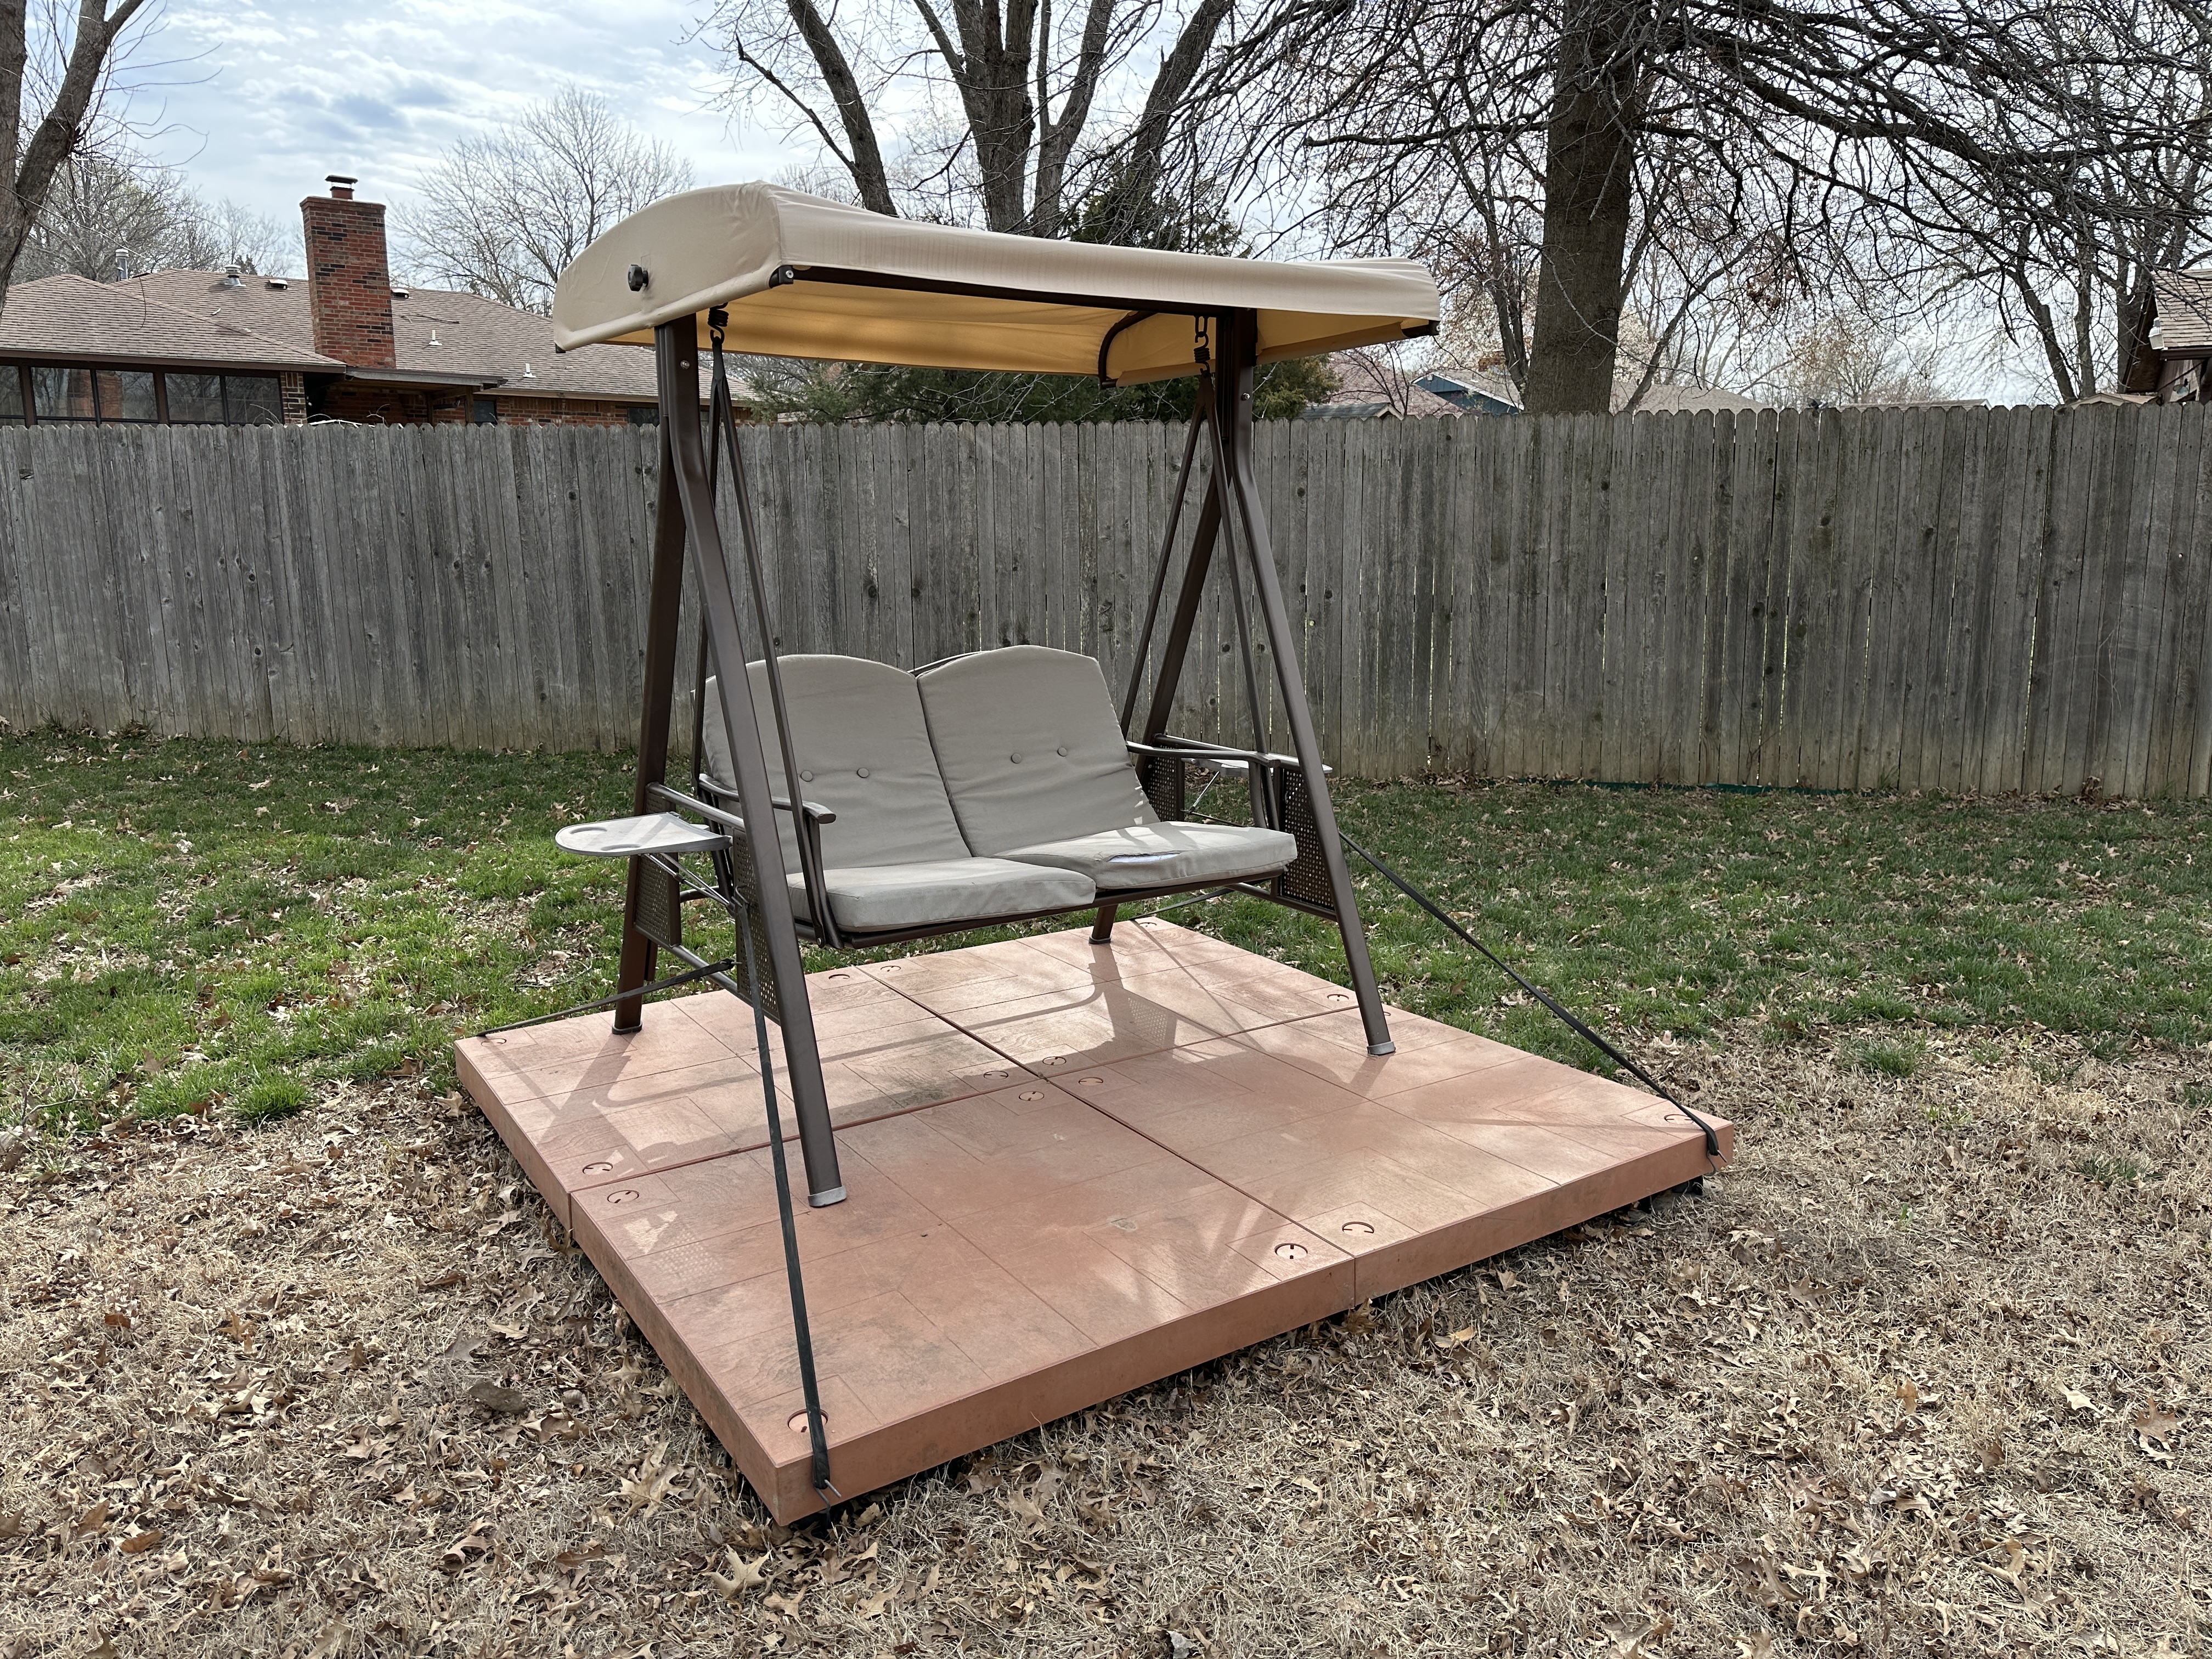
One of my backyard swings where I like to read my Kindle or listen to Audible; I wish my phone could tell me when a dryer load is done

I checked Consumer Reports, for which I’ve had a digital subscription for decades, and they recommended an electric dryer from LG. We had enjoyed using an LG washer and dryer in a rental cabin, so that sealed the deal.

The dryer is fine, although being a 240-volt electric unit, its cycle time is longer than the natural gas dryers I was used to, yet still far superior to the 120-volt electric dryer I used in 1989-1990. We like the tune it plays when a load is done, although it is one of the few appliances that I wish had a WiFi connection so that I could be out on my swing in the backyard and get an alert when it is done. I have compensated by setting timers on my Apple Watch that help somewhat, but I have a ordered a vibration sensor to see if I can program it to alert me. [See my update at the end of this post.]

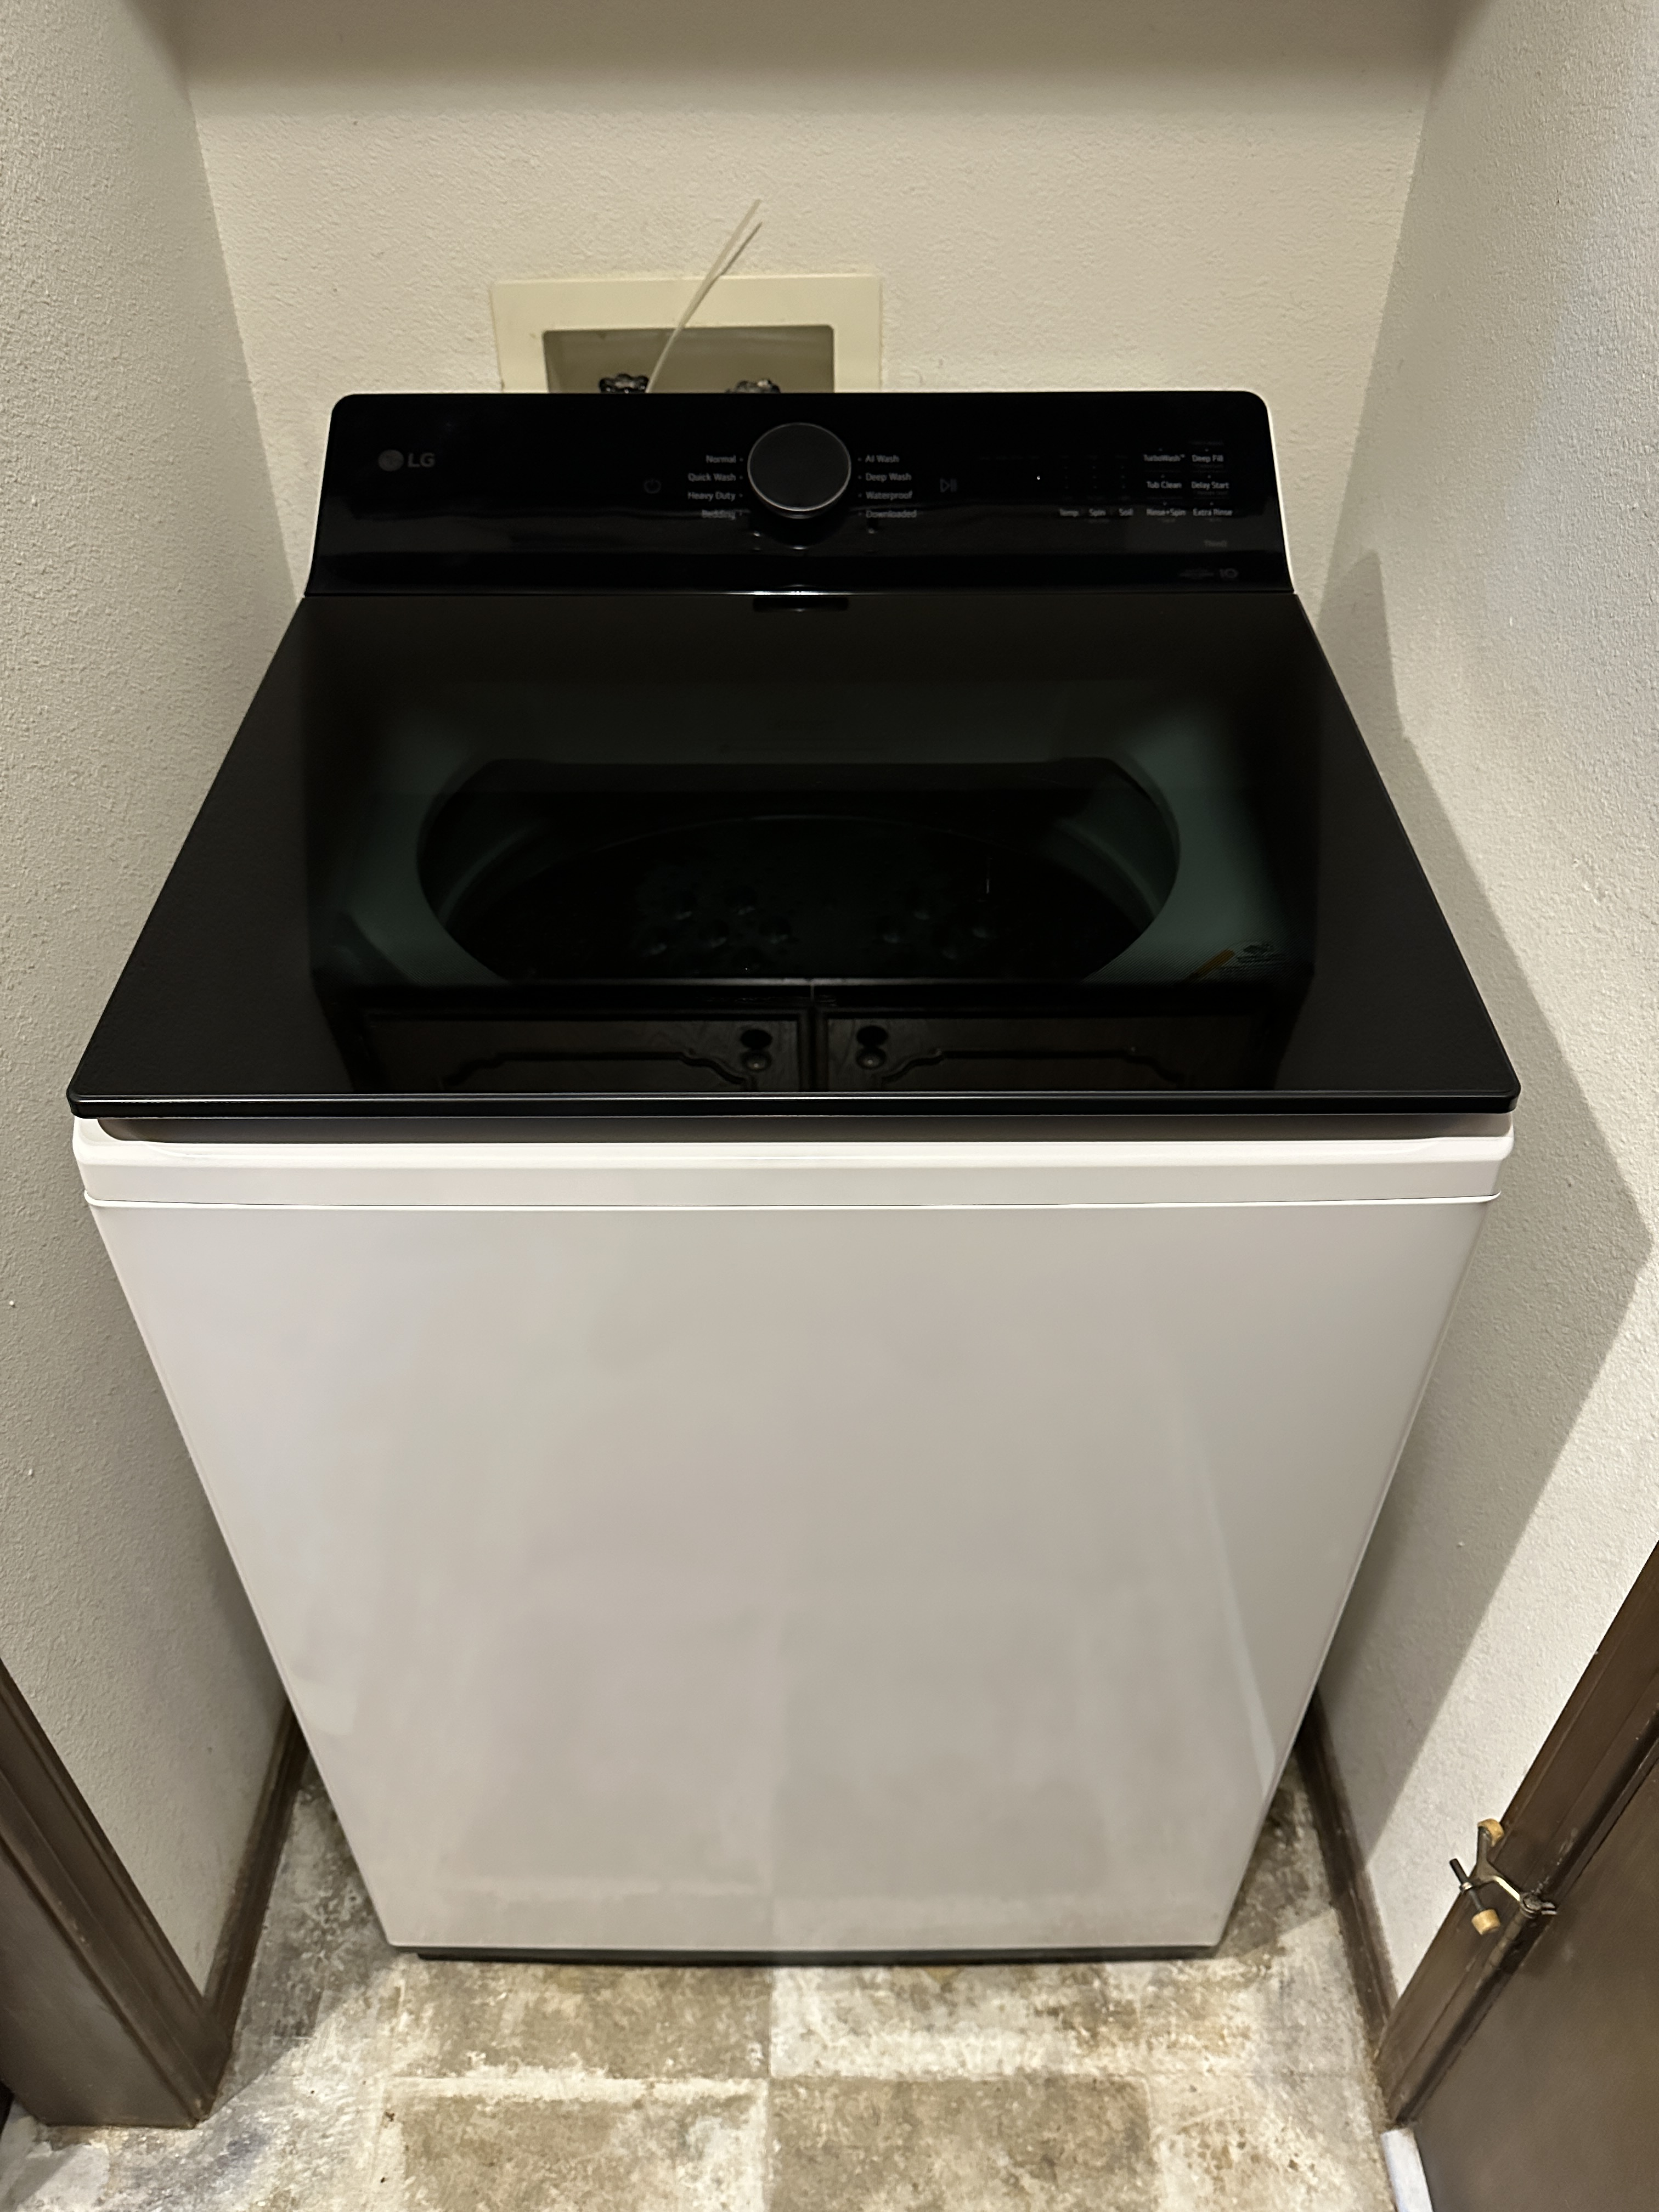
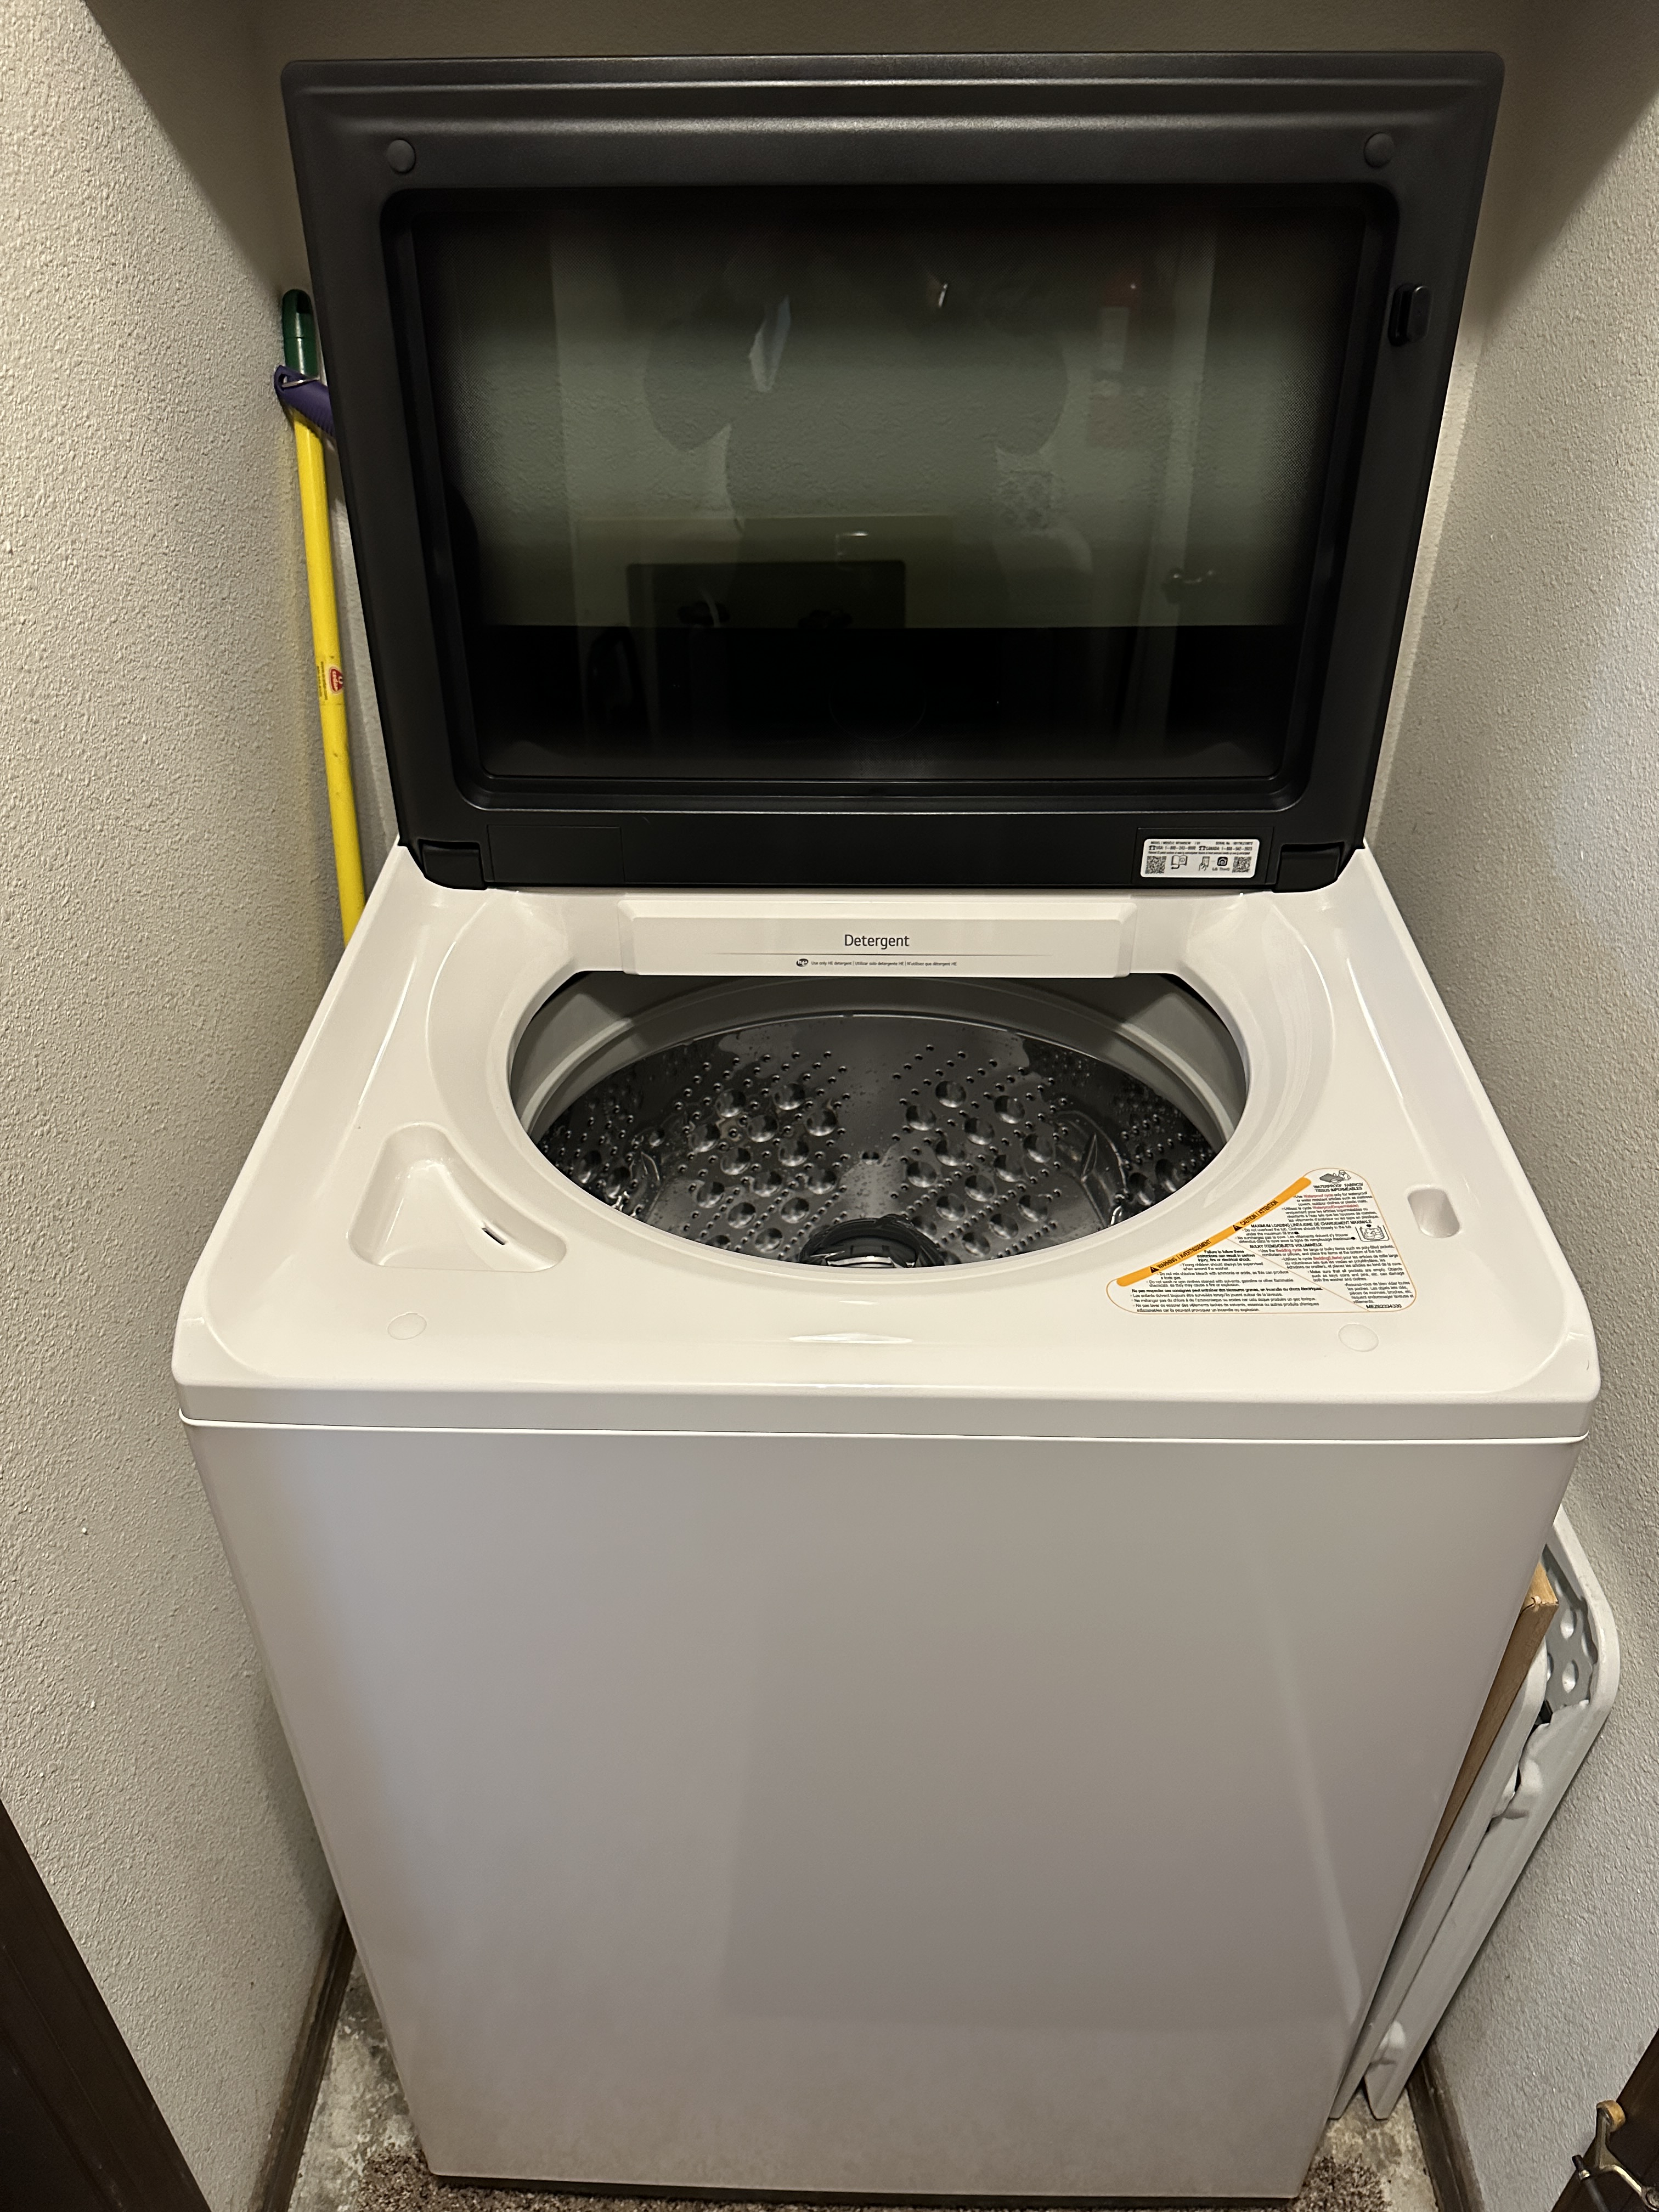
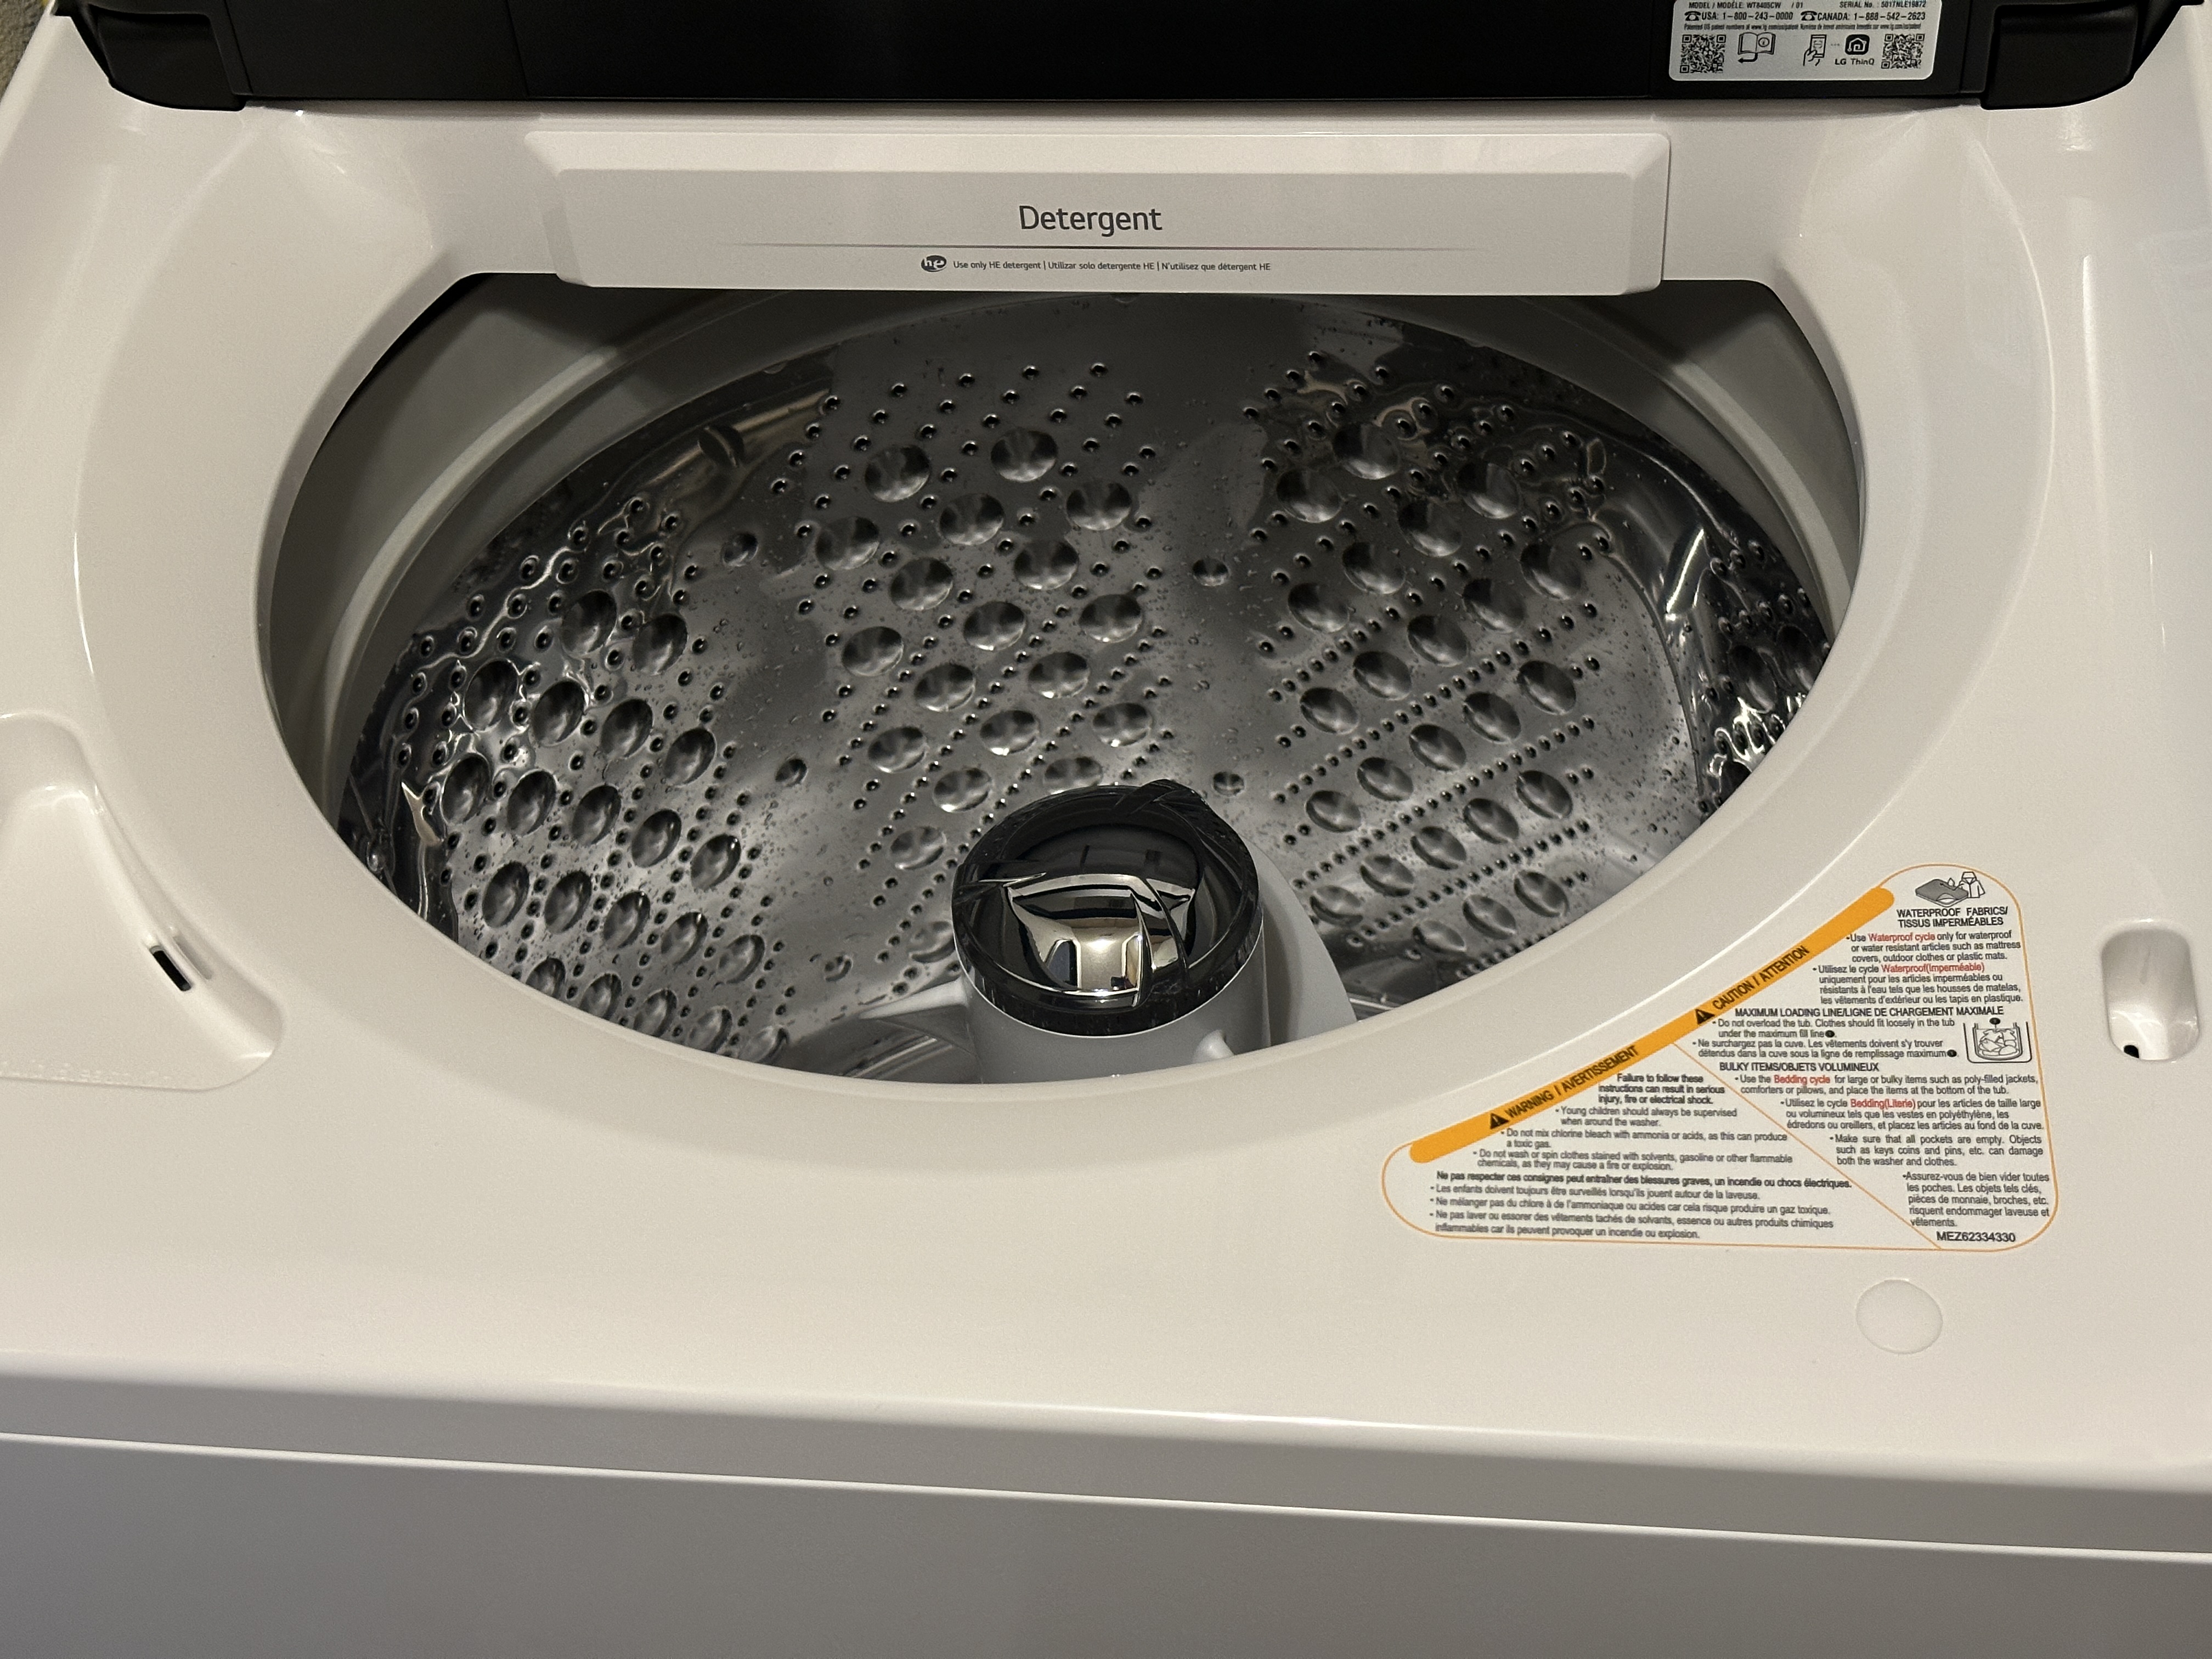
Our new washer does have WiFi, although I doubt I will need remote notifications that a load of washing is completed. I had always used top-load washers with agitators, but I read about the pros and cons of front-loaders, agitators versus wash plates in top-loaders, and how Speed Queens are very reliable but have smaller tubs. I decided to go with the highest-rated top-load agitator washer, as I didn’t want to deal with the extra cleaning to properly maintain a front-loader. That turned out to be another LG unit.

I purchased Consumer Report’s highest-rated top-load agitator washer

A Very Brief LG History

LG was once Lucky-GoldStar. It was founded in South Korea in 1947 as Lak Hui Chemical Industrial Corporation; Lak Hui is pronounced “Lucky” in English. It established GoldStar in 1958 as it expanded its plastics business, and the company manufactures electronics, chemicals, appliances, and telecommunication devices. Four generations of the Koo family have managed the company.

In recent years, LG models have consistently ranked high in Consumer Reports, and I have enjoyed the 55″ LG OLED television I purchased in 2017. However, I grin when I remember that LG stands for Lucky-Goldstar, since there was a time decades ago when they were known for cheap bargain-basement electronics.

My 1996 Maytag washer completed the largest load in about 25 minutes; modern-day washers typically take much more time, although they use less water and energy. Our new LG washer would take 90 minutes to complete its most aggressive normal cycle with Consumer Report’s eight pound test load. They report wash times from 65 to 120 minutes for front-loaders and 40 to 100 minutes for top-loaders with agitators.

Our dryer typically takes 60 to 90 minutes to dry a load, and I’m not used to a washer taking that long or more. So I suspect I’ll be taking advantage of the washer’s faster “TurboWash” mode, which still won’t be as brisk as my old Maytag.

The new washer was $848 plus $38 for new connectors, $50 to haul off the old Maytag, $79 tax, and $29 delivery for $1,044 total. That’s actually cheaper than my Maytag, which cost $686 with tax back in 1996, which would be about $1,400 in 2025 when adjusted for inflation. Even better, my old Maytag used 923 kilowatt-hours per year in the government’s tests, while the new LG uses only 210 kilowatt-hours per year.

However, can the LG washer last 29 years with only one fairly simple repair? Is there an LG repairman, and is he lonely? Time will tell.


Posted in history, home repair | Leave a comment

AI’s Potential Impacts on Employment

When I consider the likely impacts on employment of advancements in artificial intelligence (AI), I am naturally reminded of how automation in manufacturing blossomed in the second half of the 20th century. I’m currently reading Kurt Vonnegut’s Player Piano, his dystopian first novel in 1952 “about people and machines, and machines frequently got the best of it, as machines will.”

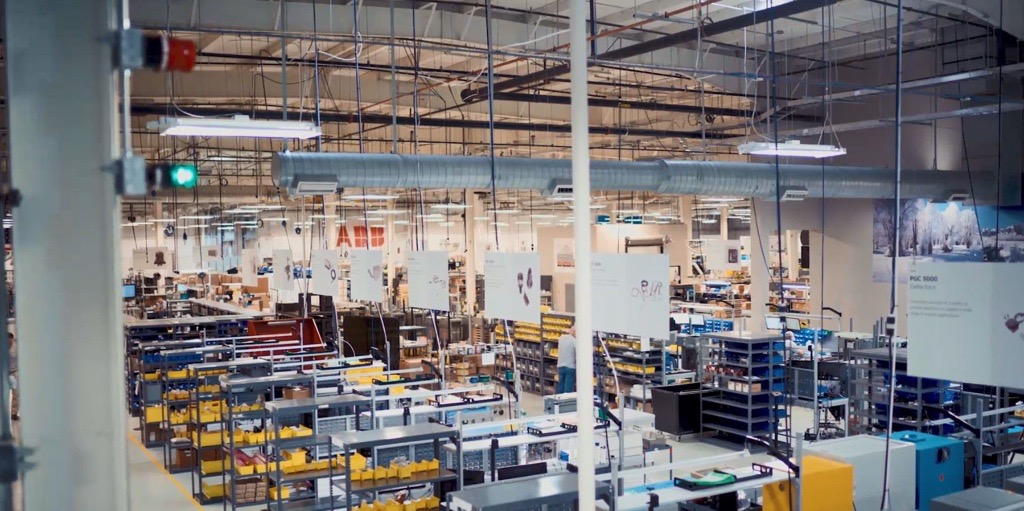
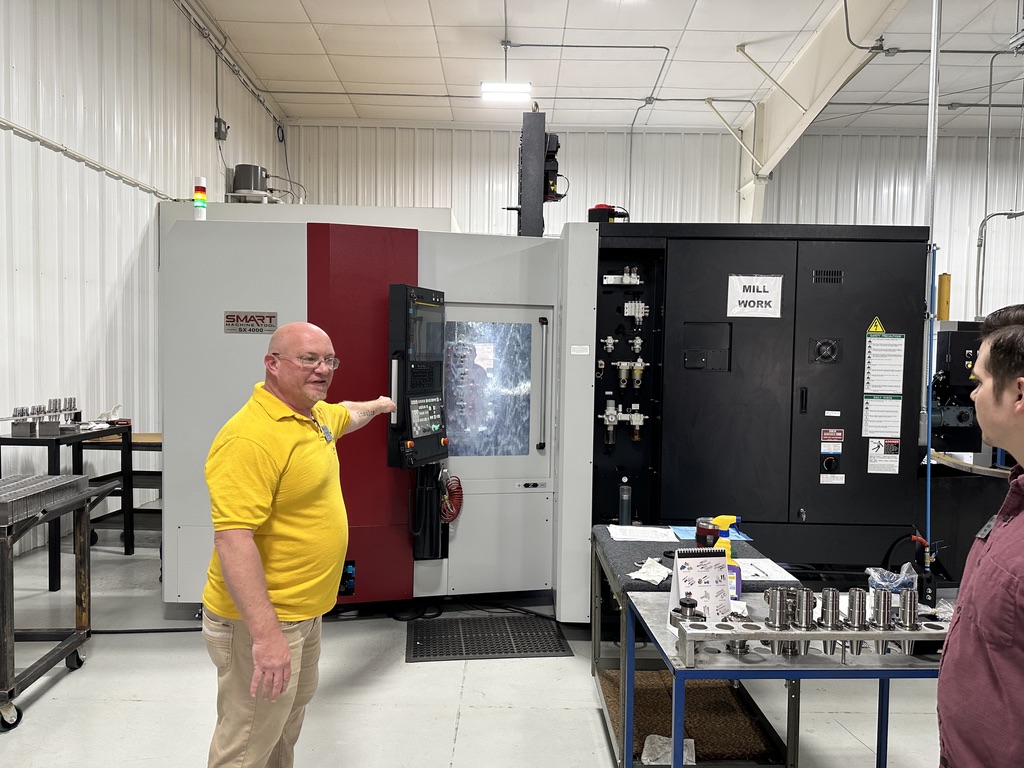
The changes in manufacturing have been driven home to me recently by tours of two plants in our local industrial park, which are radically different from the images I saw in my youth of factories and machine shops. The clean modern facilities included some sophisticated programmable machinery.

The Decline of Domestic Manufacturing

One might expect that automation led to a steady decline in manufacturing employment in the USA. However, there are significant complicating factors, including global trade and labor costs.

While it is true that over the 40 years between 1979 and 2019 manufacturing employment dropped from 22% to 9% of total nonfarm employment, that was not due to a steady erosion, but instead primarily due to three major drops during the economic recessions of the 1980s oil bust, the dot-com bust of the early 2000s, and the Great Recession of 2008 caused by a real estate bubble. The end result was that by 2019 we were back down to the domestic manufacturing employment levels of 70 years earlier, that of post-war 1949.
There were three major drops in manufacturing employment in the early 1980s, early 2000s, and the Great Recession of 2008 [Source]

Let’s break down the 40-year decline from 1979 to 2019 into categories. First we’ll look at durable goods, which shed 35% of its jobs. Every sector saw significant drops, with the biggest drop in computer and electrical products, which declined by over 40%, while wood products and furniture dropped by 1/3, as did fabricated metals and machinery.

[Source]

Now let’s turn our attention to nondurable goods, which shed over 1/3 of its jobs over those four decades. Worst hit were the USA’s apparel and textile industries, which lost an astonishing 80% of their jobs. That’s twice the painful loss of over 40% of the jobs in the paper and paper products industries. About 1/3 of petroleum jobs were lost in the oil crash of the 1980s and another 1/4 since then, while overall the jobs in chemicals are down about 20%. Printing and publishing rose until 2000 and then dropped, landing at about 10% below its levels of 40 years ago. Plastics and rubber also rose until 2000 and then dipped, landing about 5% down overall. The only area to show growth was food manufacturing.

[Source]

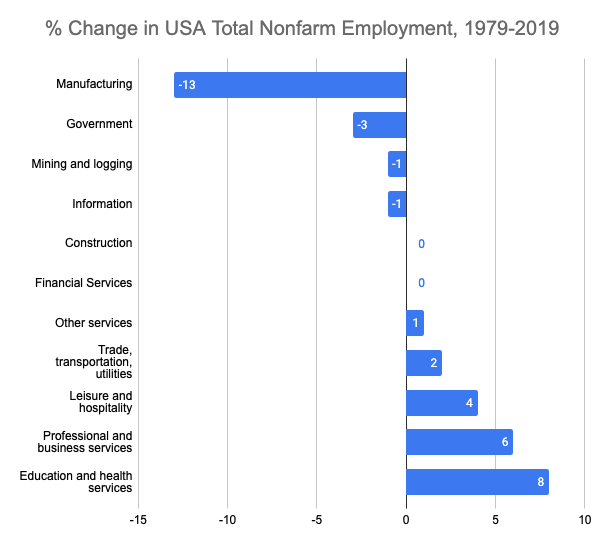
So how did that change the employment mix? The chart below shows how the loss in manufacturing jobs was accompanied by a growth in services along with leisure and hospitality.

[Data Source]
[Source]

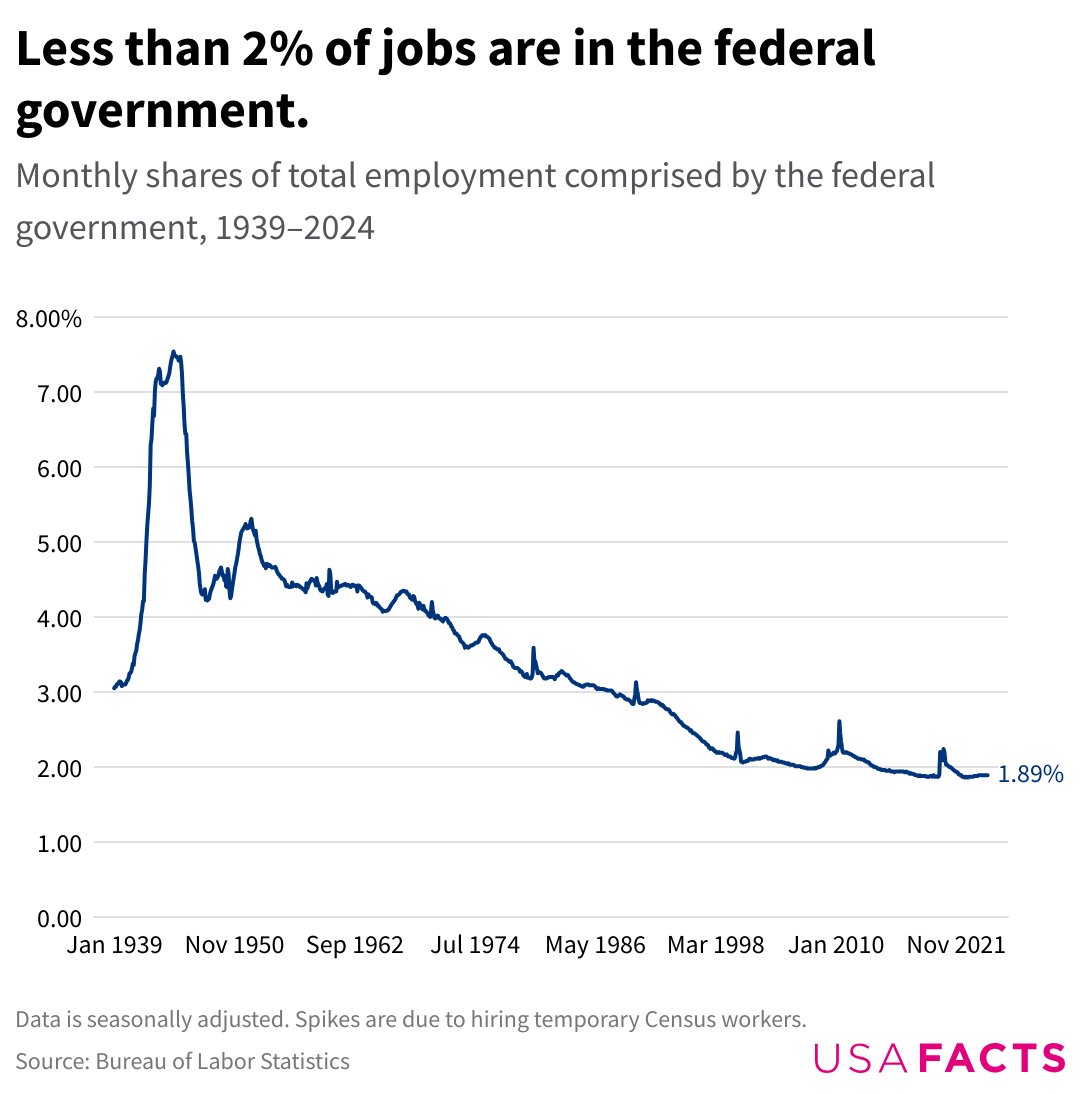
It is also interesting to note that despite the flogging of government as bloated and inefficient by the Reagan administration at the start of the period and the current decimation of government jobs at the start of the second Trump presidency, government actually declined from 1979 to 2019 in the percentage of total employment.

The loss of manufacturing jobs in the USA was not merely due to automation, but also increased global competition. Lower labor costs led companies to relocate production to other countries, and labor shortages that include the “great retirement” of the baby boomers have also had significant impacts. Trump promotes tariffs as a response to lower labor costs and lax regulations in other countries, while many economists warn that tariffs create market distortions that lead to long-term harm to domestic consumers and eventually retard industrial progress and efficiency.

The Progress of Artificial Intelligence

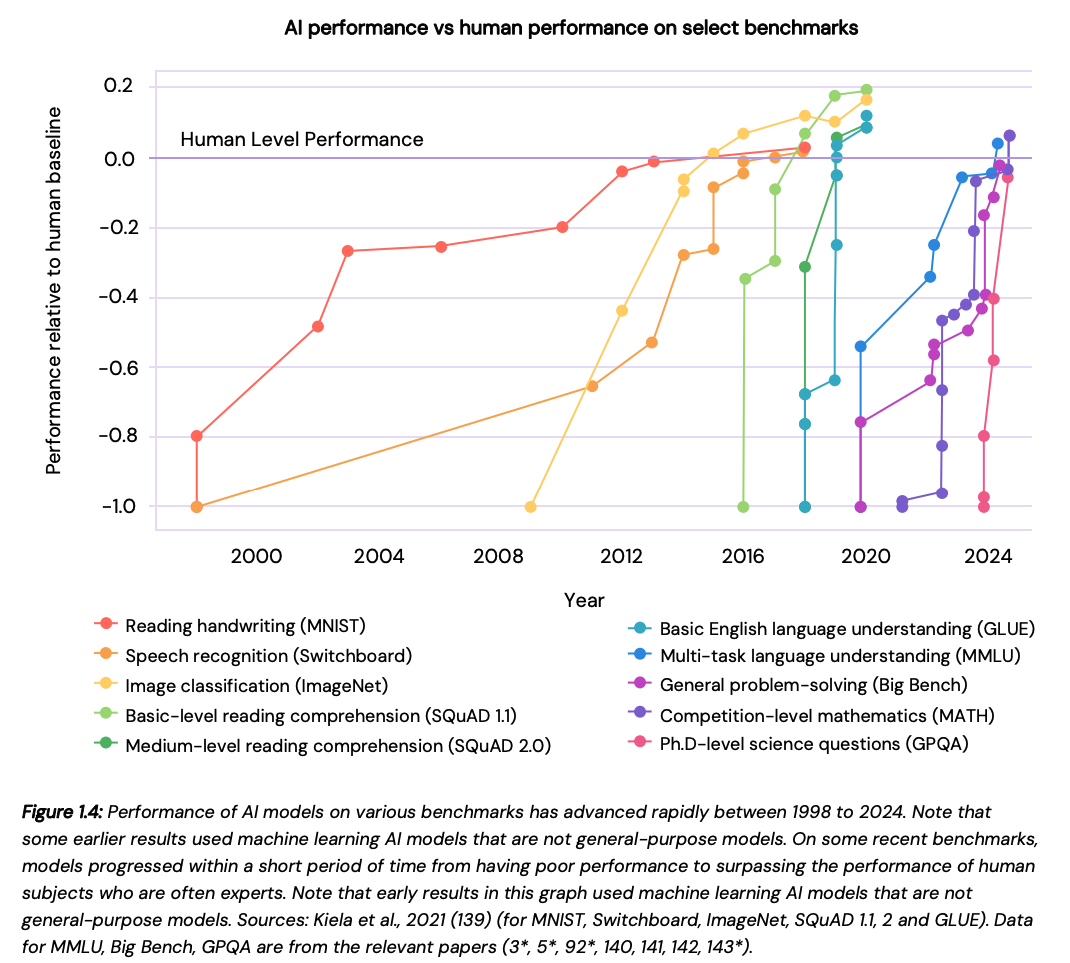
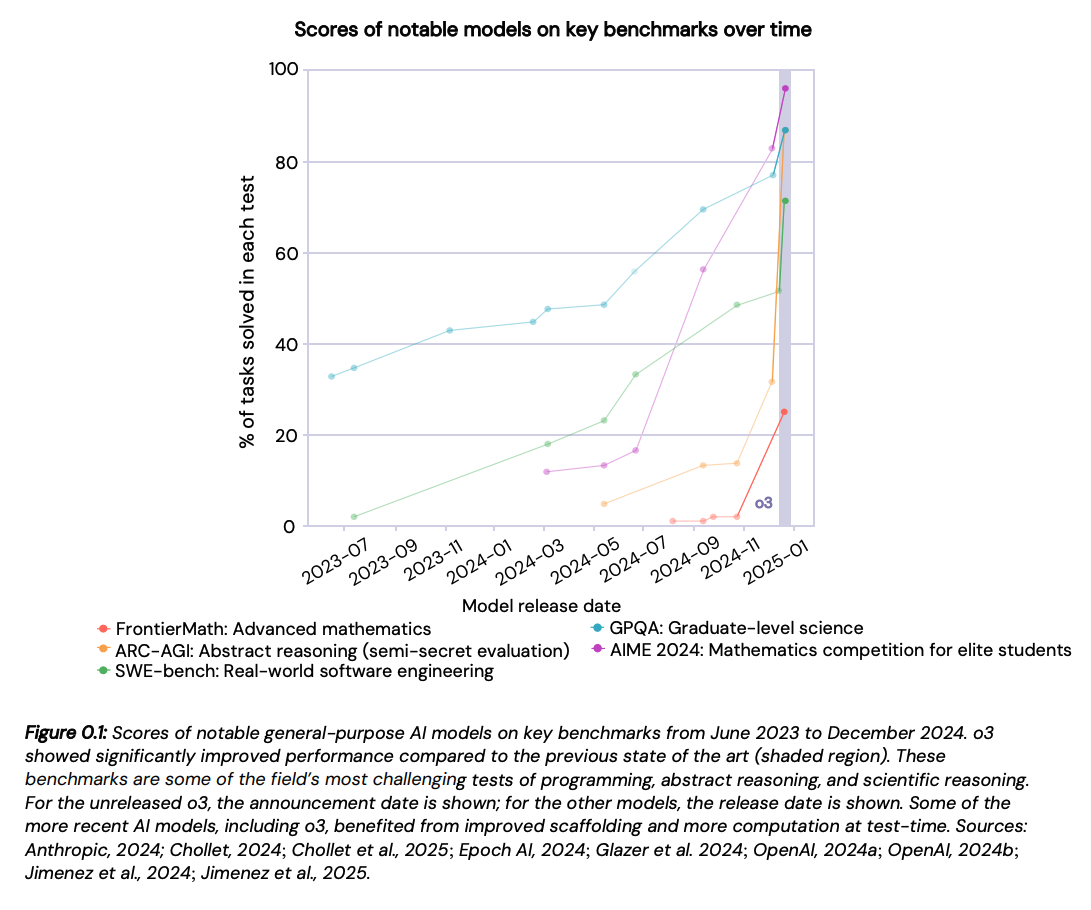
How much might AI impact employment in the various sectors? First, let’s confirm the impression that AI is making significant headway. General purpose AI models are now showing marked improvement on the most challenging tests of programming, abstract reasoning, and scientific reasoning.

General purpose AI model performance on the most challenging tests of programming, abstract reasoning, and scientific reasoning [Source]

Over the last decade, general-purpose AI systems have achieved or exceeded human-level performance on benchmarks across a wide variety of domains, such as natural language processing, computer vision, speech recognition, and mathematics.

[Source]

What is not clear is how impressive performance on benchmarks translates into performance in real-world tasks. According to the January 2025 International AI Safety Report, “current general-purpose AI systems often demonstrate uneven performance, excelling in some domains while struggling in others, which makes overly general comparisons less meaningful. While general-purpose AI now outperforms humans on some benchmarks, some scientists argue that it still lacks the deep conceptual understanding and abstract reasoning capabilities of humans.”

You are likely aware of how current large language model artificial intelligence can “hallucinate”, providing misleading and incorrect results. There are developing concerns about privacy, cost, and environmental impacts of AI systems.

AI Automation & Augmentation Both Bring Disruption

Nevertheless, according to the report, “General-purpose AI differs from previous technological changes due to its potential to automate complex cognitive tasks across many sectors of the economy. Unlike labour-saving innovations of past centuries that primarily automated physical tasks or routine computing tasks, general purpose AI can be applied to a wide range of complex cognitive tasks across multiple domains, ranging from mathematics to computer programming to professional writing.”

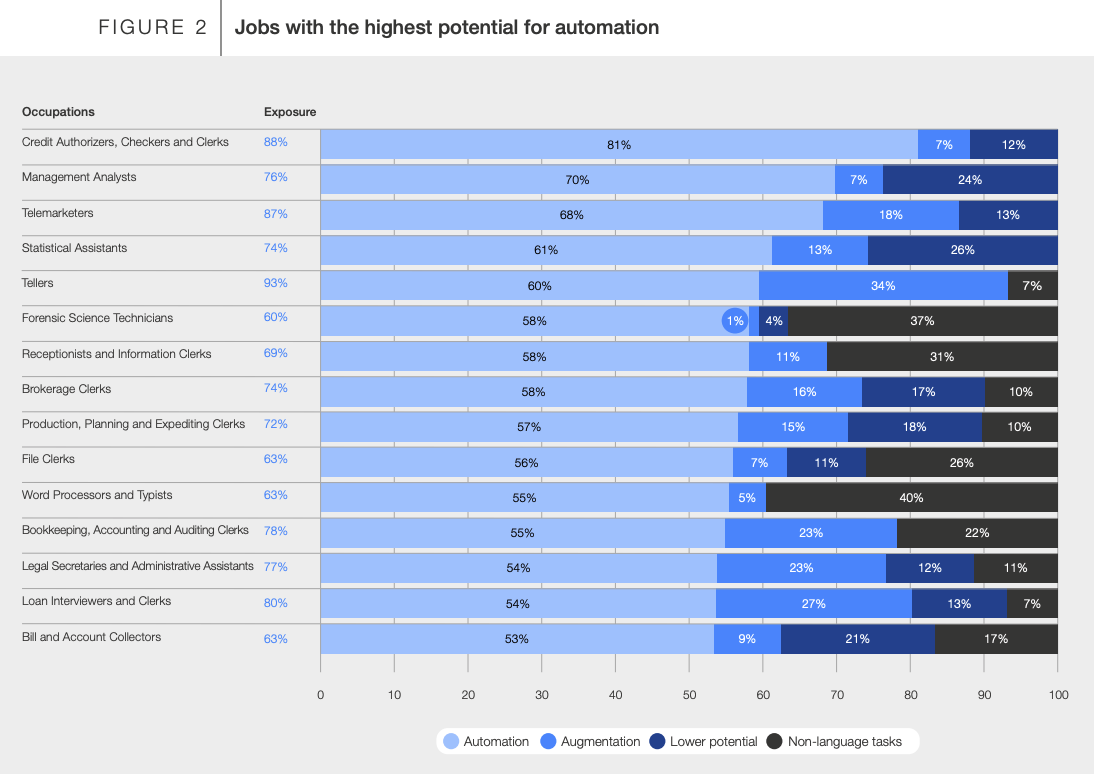
One study estimated that in advanced economies 60% of current jobs could be affected by today’s general-purpose AI systems. A 2023 white paper at the World Economic Forum identified occupations and sectors that are now vulnerable to AI automation.

[Source]

Those jobs are at high risk as AI develops, with machines, not humans, eventually performing many of their tasks.

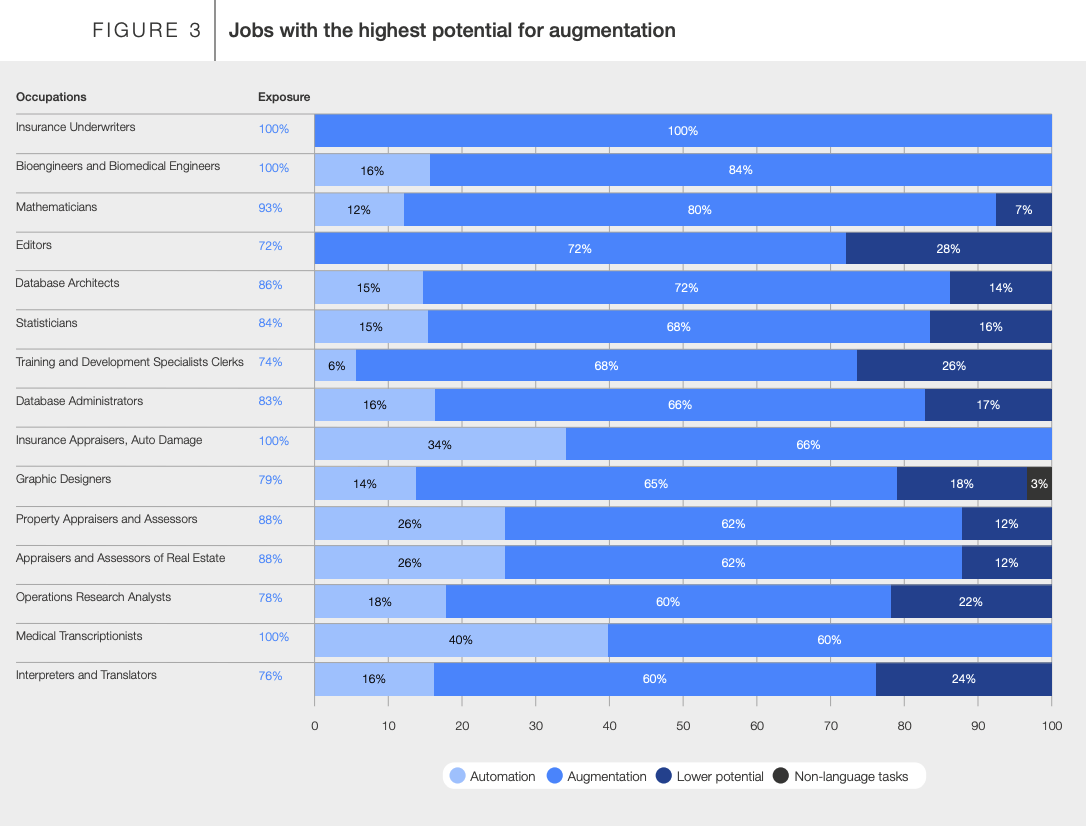
Other jobs are exposed not through automation, but via augmentation. Humans will continue to perform these tasks, but AI will increase human productivity, which in turn can mean fewer job positions.

[Source]

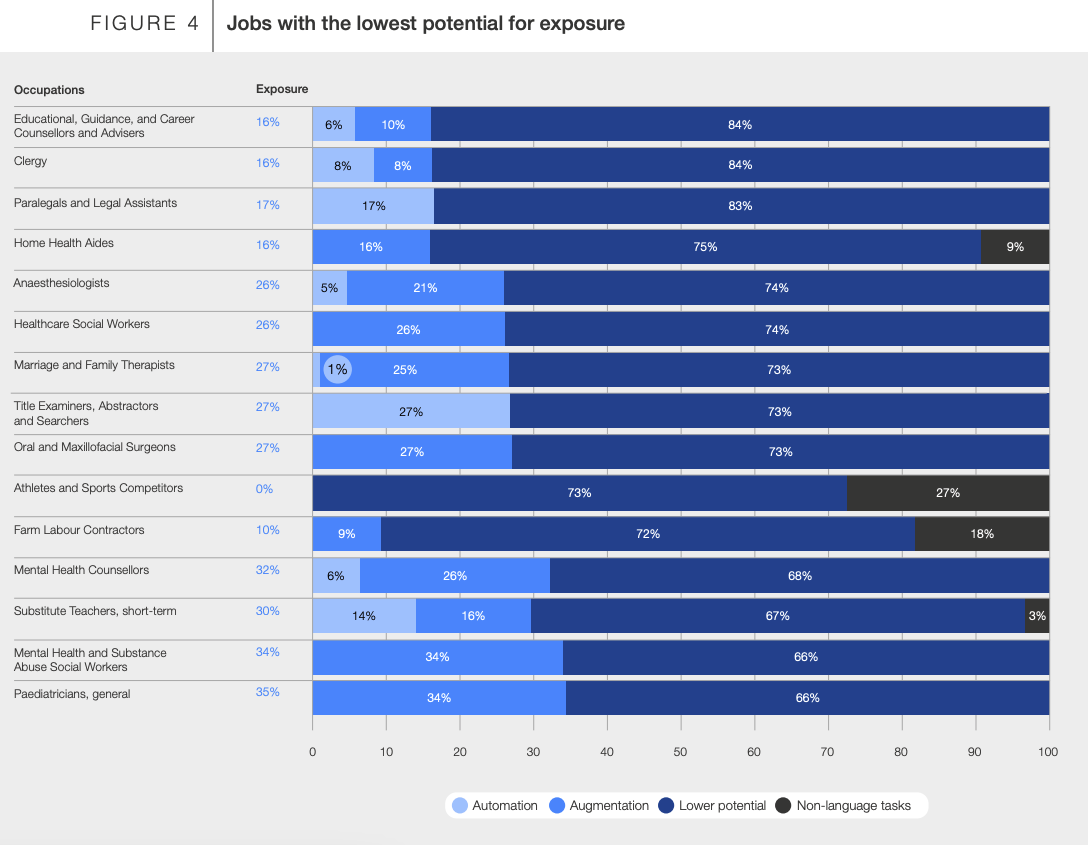
Jobs that require a high degree of personal interaction or physical movement are the least threatened by current AI trends.

[Source]

Jobs with little to no potential to be impacted by the adoption of large language models in the workplace include dishwashers, highway maintenance workers, meat cutters, rail-track laying and maintenance equipment operators, carpenters, slaughterers, oil and gas roustabouts, pressers, and fiberglass laminators and fabricators.

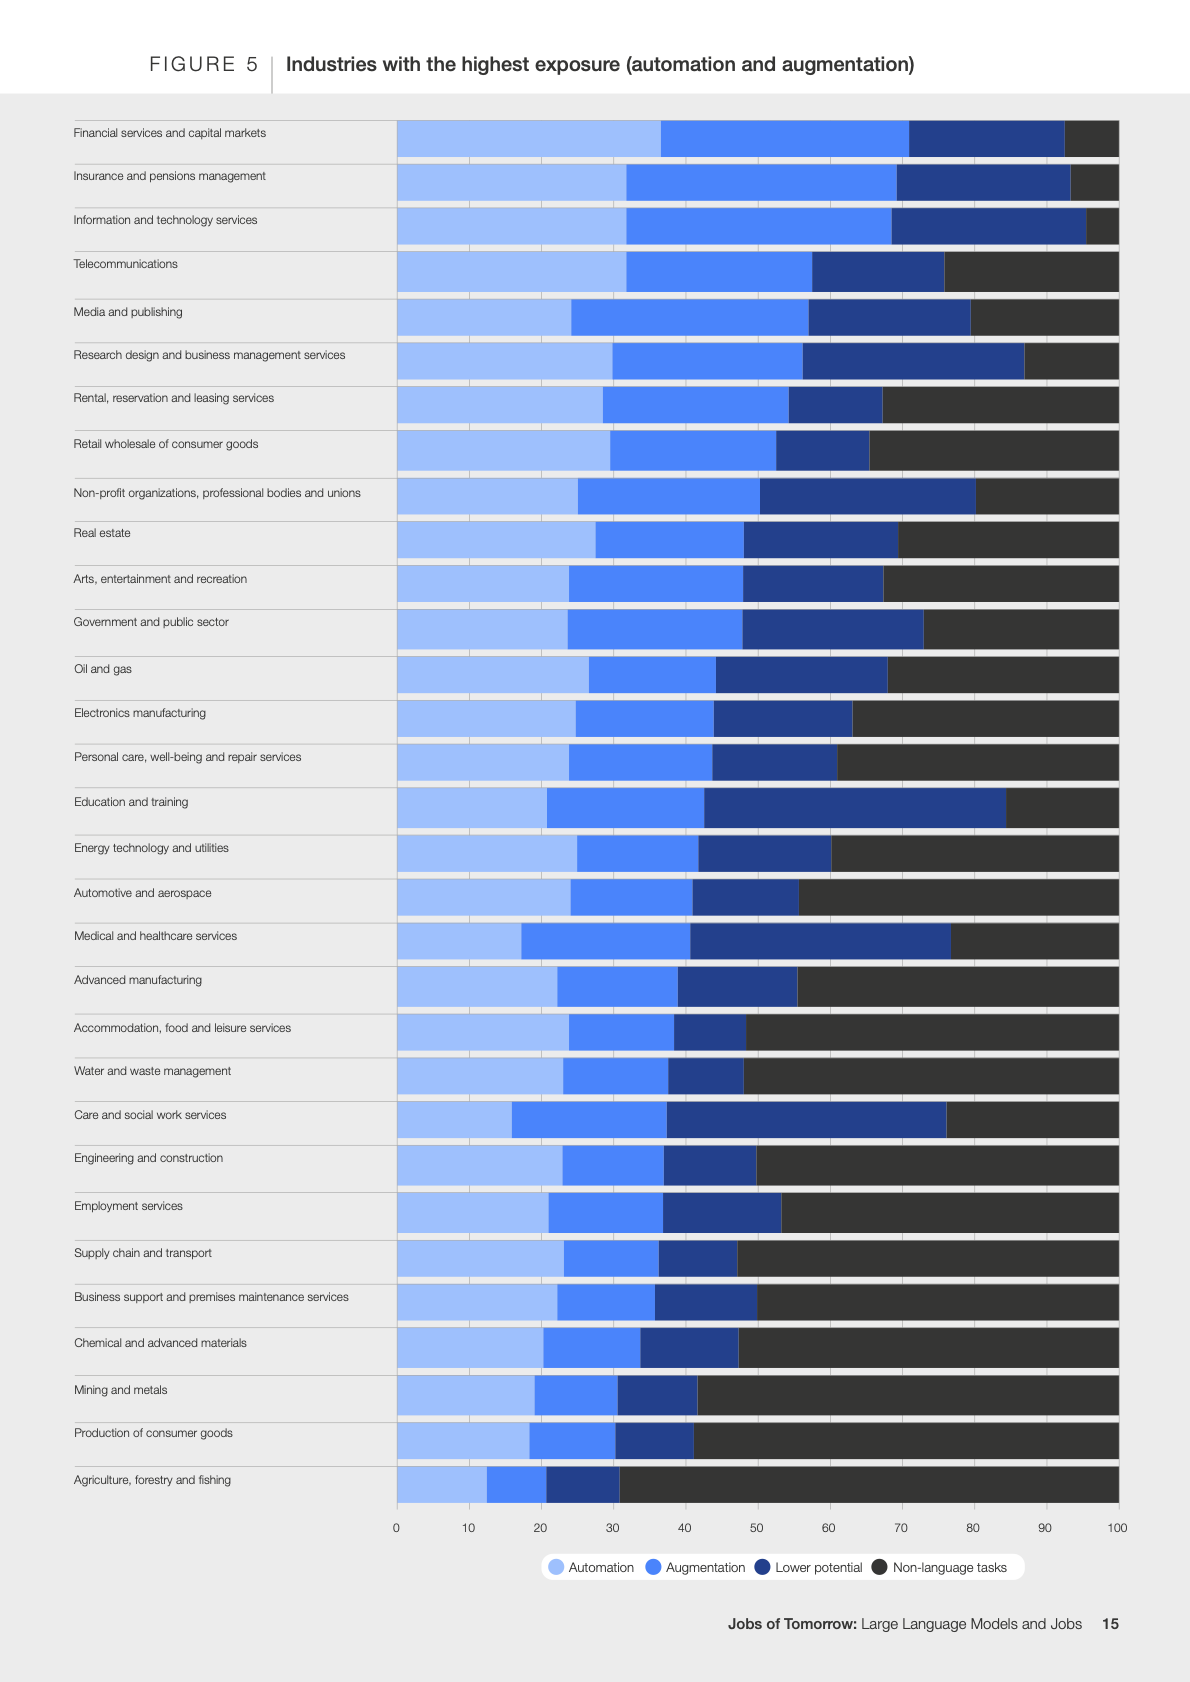
Switching from tasks to industries, below are the ones with the highest exposure to AI automation and augmentation.

[Source]

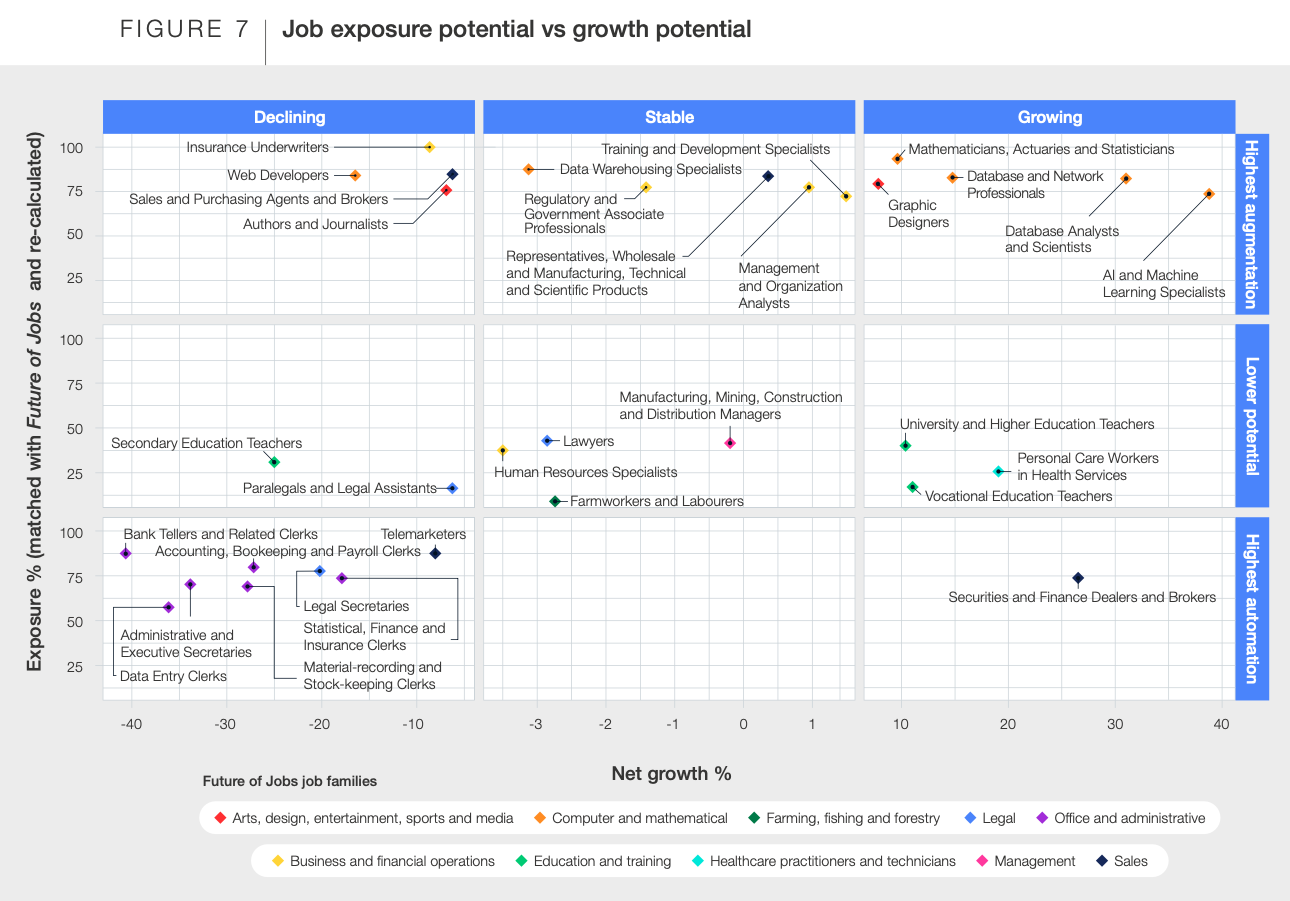
Another chart combines job exposure to AI with overall growth potential. Jobs on the left side of the chart are expected to decline, with the bottom left dramatically impacted by AI automation.

[Source]

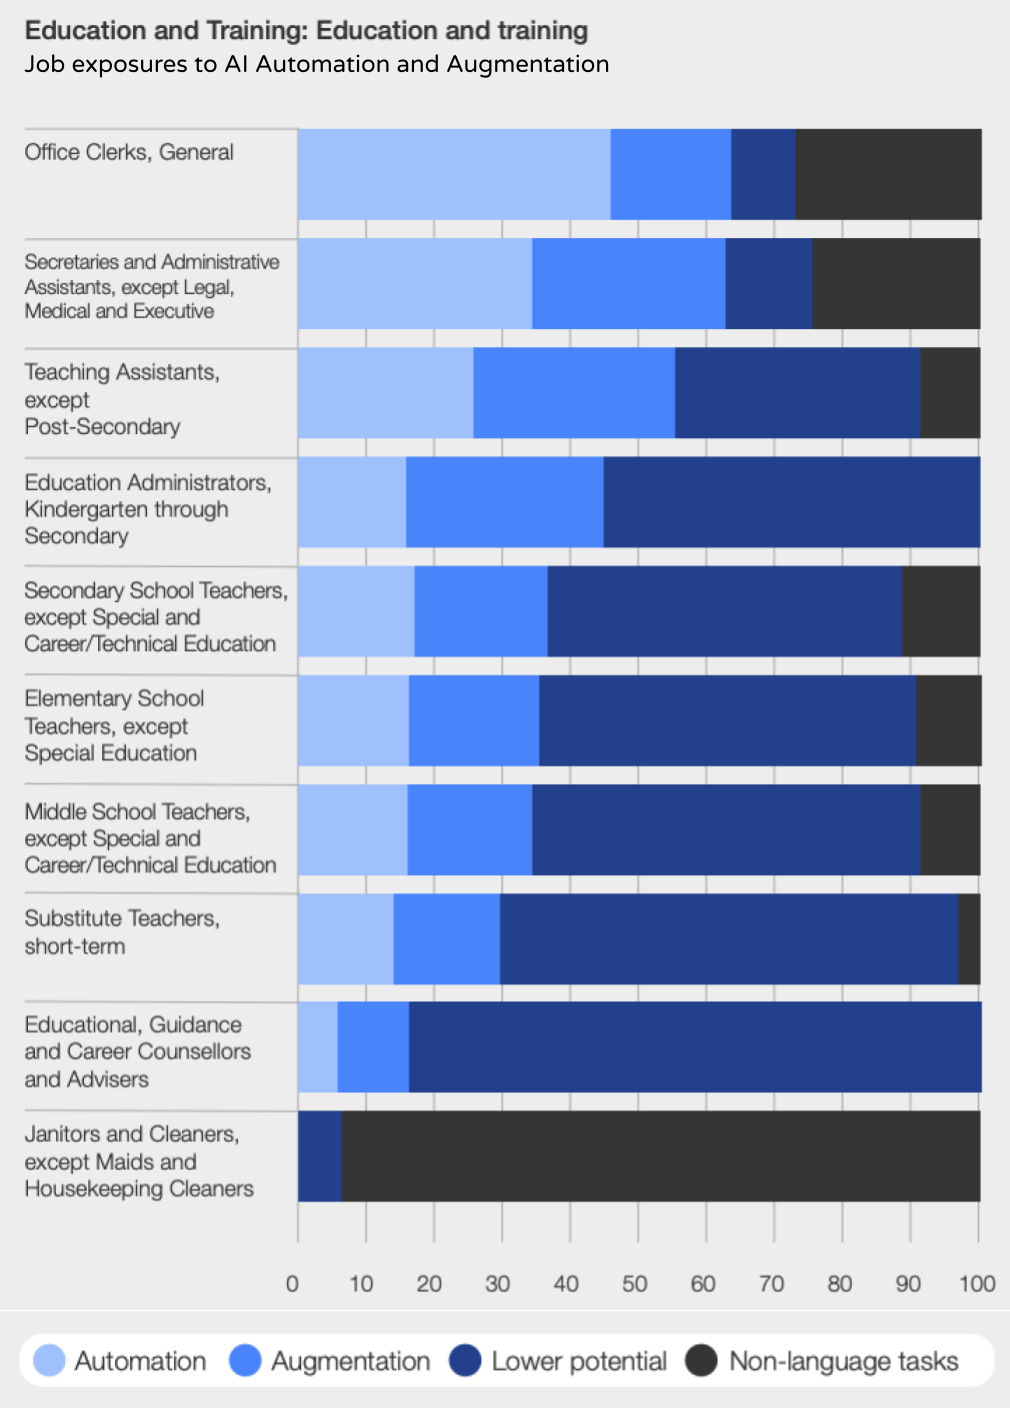
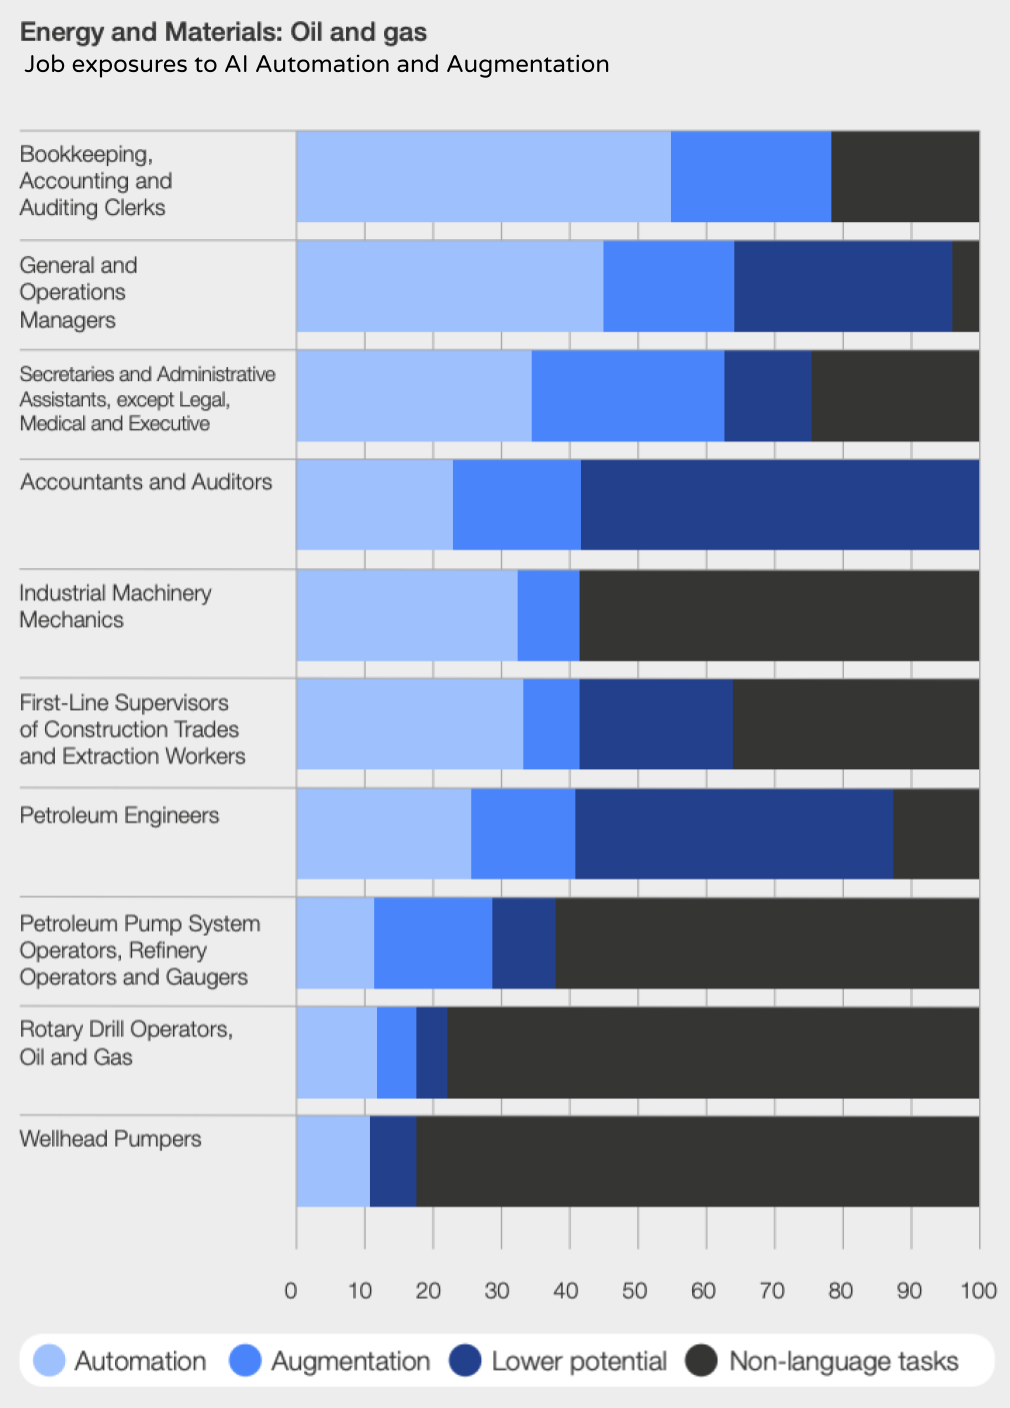
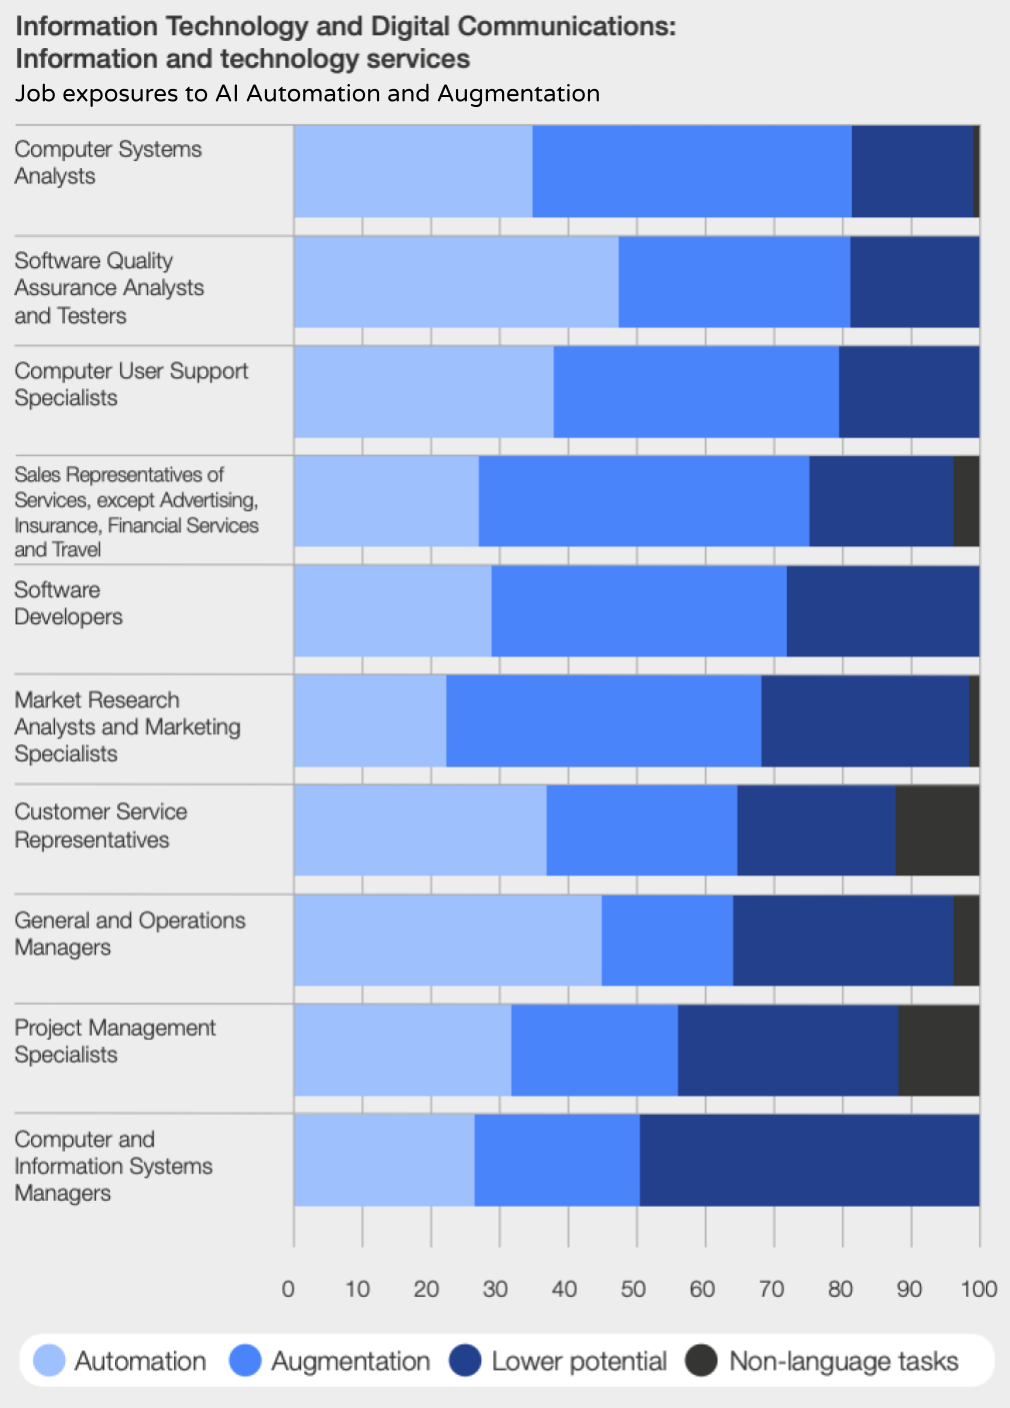
I will point out that the appendix on pages 20-29 of the report is particularly interesting, as it has charts of the job exposure to large language model AI within specific industries.

For example, here are the exposures in my own career field of education:

Bartlesville’s largest employers are still in oil and gas, and here are the AI exposures for that industry:

For some time, students have been encouraged to pursue careers in information technology, but those positions are now among the most exposed to AI disruptions:

That final chart reminds me of the ouroboros, the snake eating its tail. Some perceive it as a symbol of the cycle of life, representing continuity and eternity. However, I have always perceived it as a symbol of self-destruction. Automation’s spread into new realms is certain to bring disruptions that will again shift employments.

Posted in technology | Leave a comment